

In my founding post, I walked through what my market timing signal did to the S&P 500 over 26+ years: $10,000 became $1.75 million, with a worst drawdown of −8.5% versus −50.8% for buy and hold. Same index, same money — the only difference was knowing when to be in cash.
Today I want to show you the same signal on a more volatile index: the Nasdaq-100, via QQQ.
If SPY shows the system’s discipline, QQQ shows its power. The Nasdaq is more growth-heavy, more volatile, and far more punishing in a crash — which is exactly why timing matters more here. And the numbers, drawn from the same independent Portfolio Visualizer report, are the most striking I’ve ever produced.
$10,000, two paths, 26+ years
Here is the same $10,000 invested in QQQ from January 2000 to July 2026. One line simply buys and holds the Nasdaq-100. The other follows my timing signal — in the market when it says BUY, in cash when it says SELL.
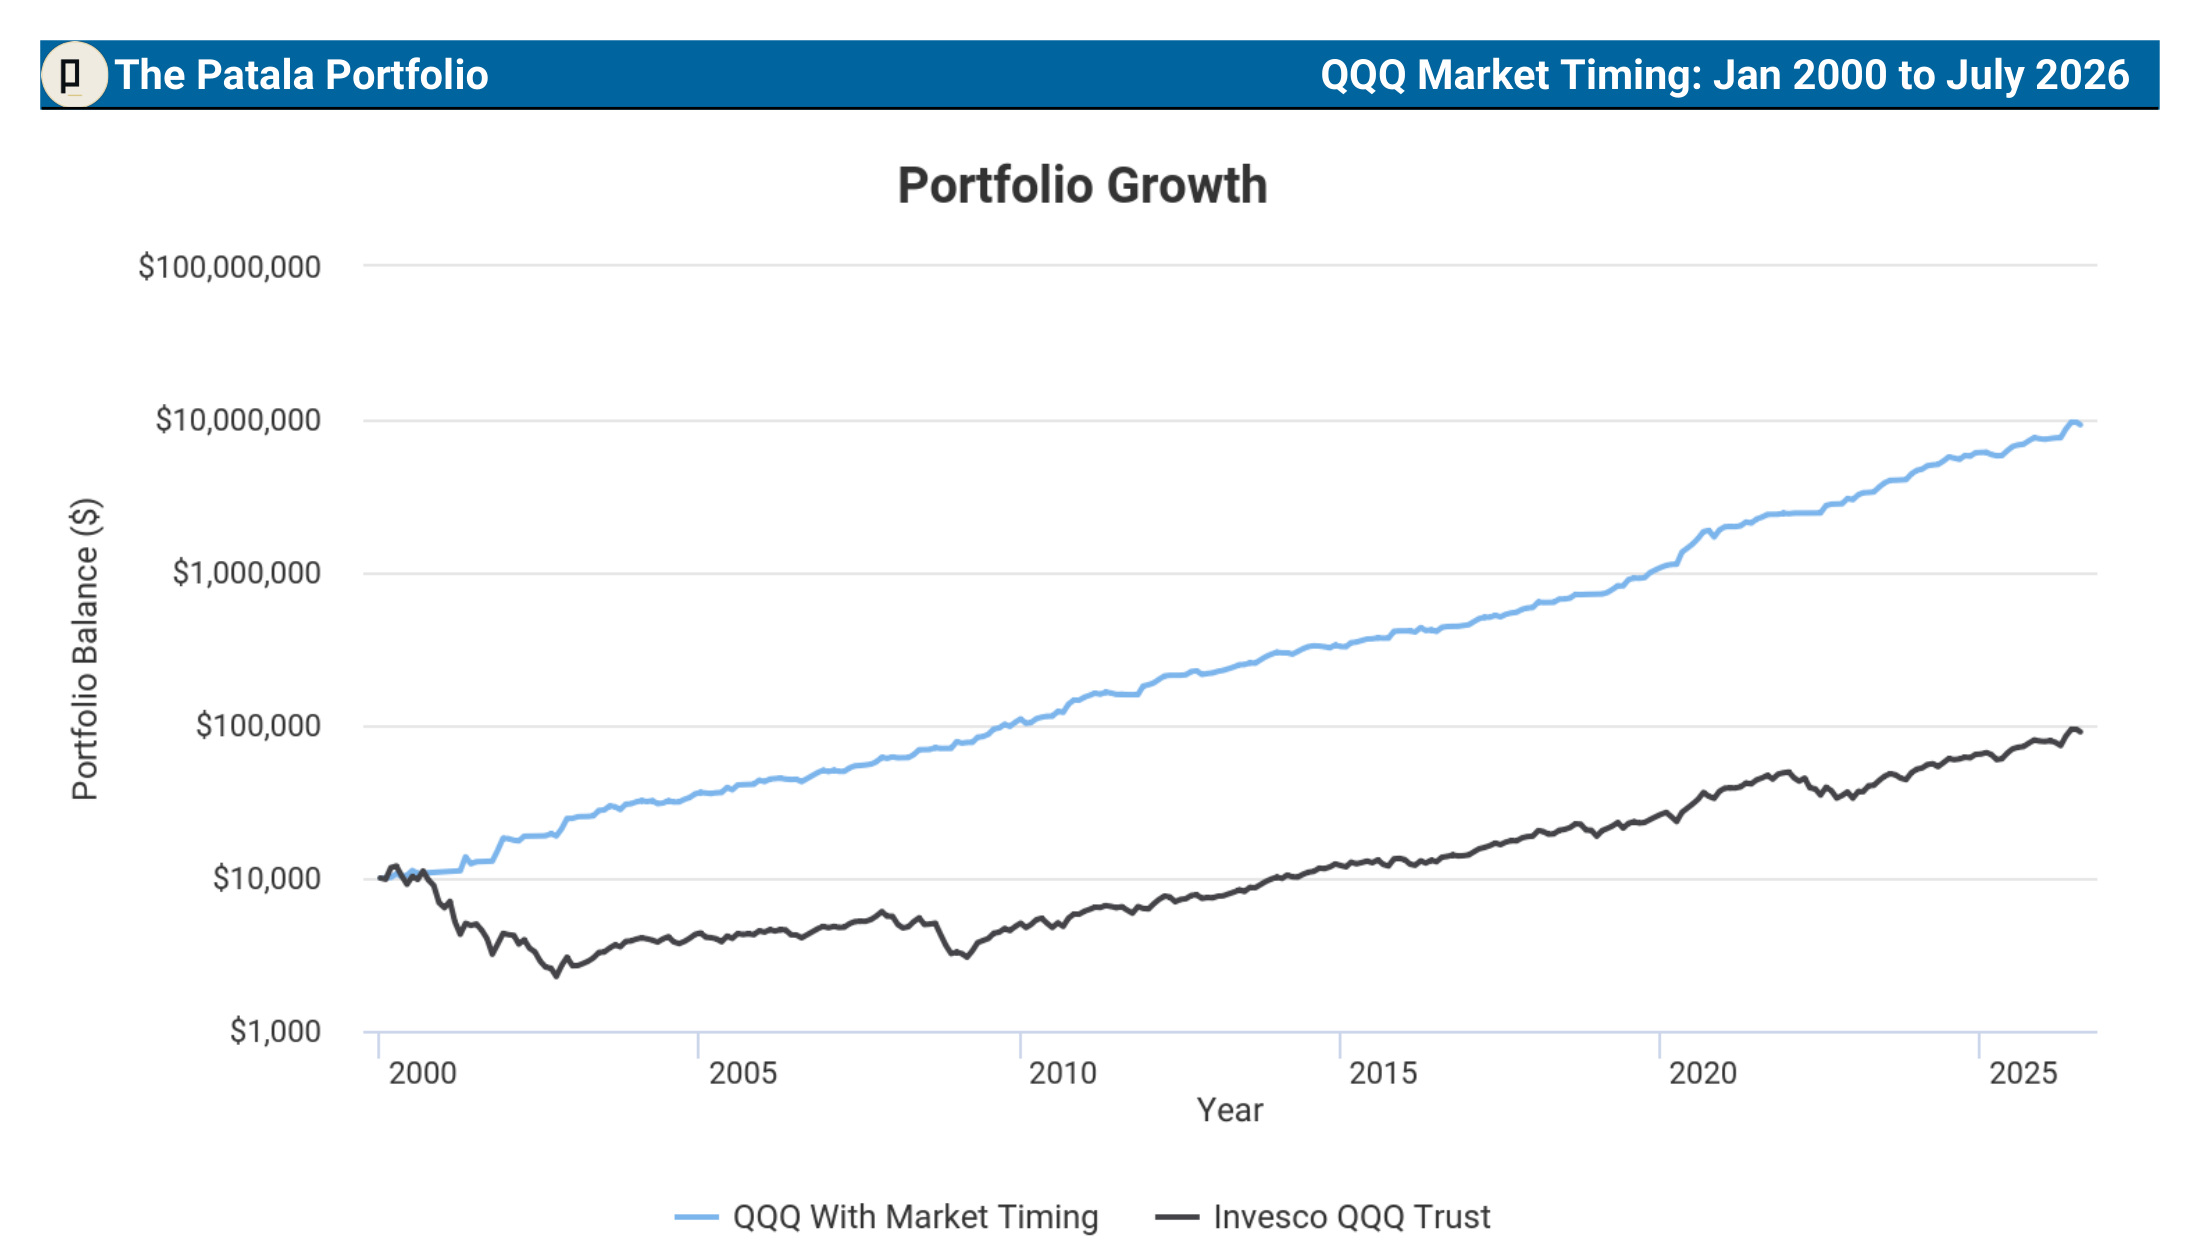
The timing signal turned $10,000 into $9,230,360. Buy and hold turned the same $10,000 into $90,406.
That is not a typo. Over 26+ years, the signal produced more than 100 times the ending wealth of buying and holding the exact same index. The CAGR tells the story in one line: 29.28% a year with the signal, versus 8.64% for buy and hold.
Why is the gap so much larger than it was for SPY? Because the starting point — January 2000 — sits right at the top of the dot-com bubble, and the Nasdaq’s collapse from there was far deeper than the S&P’s. Which brings us to the real story.
The 81% crash the signal simply avoided
Here’s what took me years to fully appreciate: the power of this system isn’t in the gains. It’s in the losses it never takes.
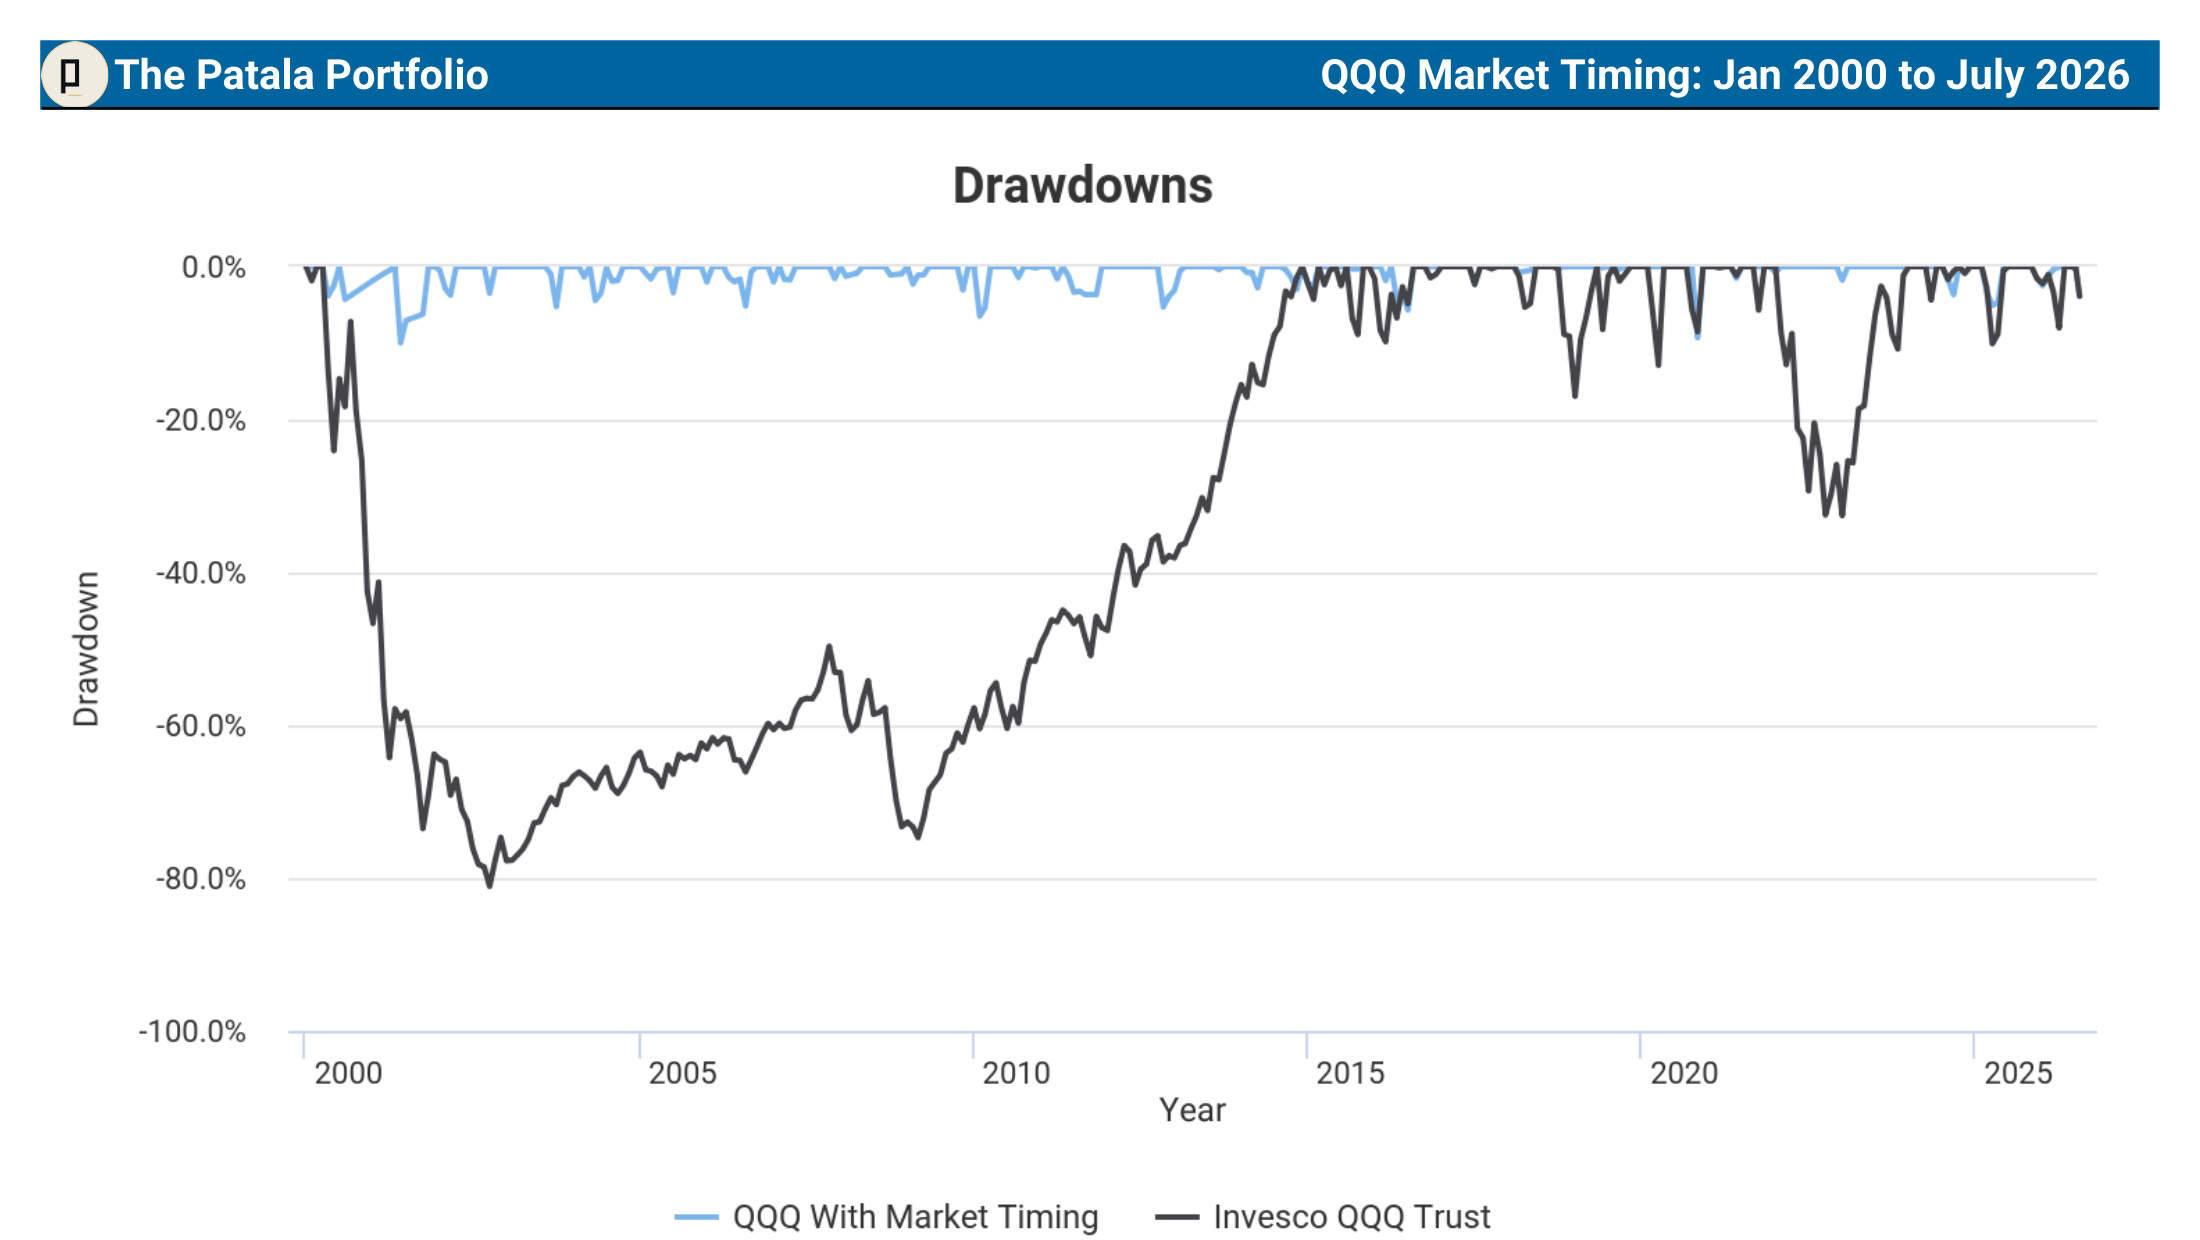
A QQQ buy-and-hold investor who put in $10,000 in January 2000 watched it fall 81% over the next two and a half years. To recover from an 81% loss, you need a gain of more than 400% just to get back to even. It took the Nasdaq roughly 14 years — until late 2014 — to make that investor whole again.
The timing signal’s worst drawdown over the same 26+ years was −9.97%.
Look at the stress-period numbers from the report:
Dot-com crash (2000–2002): signal −9.97% vs buy & hold −81.08%
Subprime crisis (2007–2009): signal −2.29% vs buy & hold −49.74%
COVID-19 crash (2020): signal 0.00% vs buy & hold −12.90%
During COVID, the signal’s drawdown was zero. It was already in cash when the market fell.
The signal didn’t beat buy and hold by being a better stock picker. It owns the exact same index. It simply wasn’t there for the catastrophes.
Every risk measure, side by side — 26+ years
I’m an engineer, so here’s the full dashboard rather than a cherry-picked stat. Straight from the Portfolio Visualizer report:
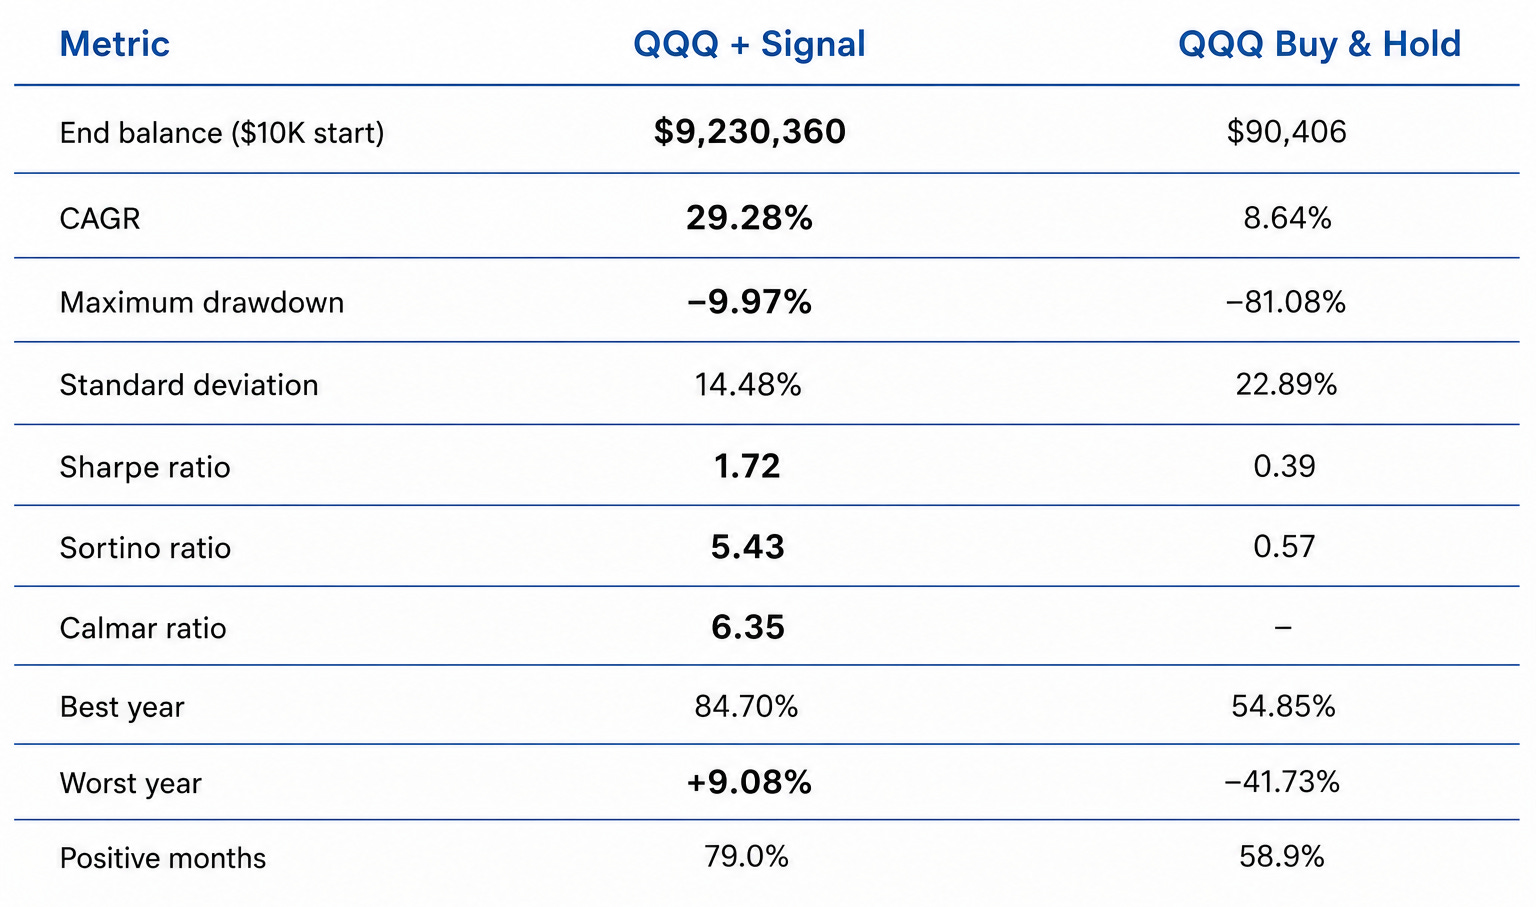
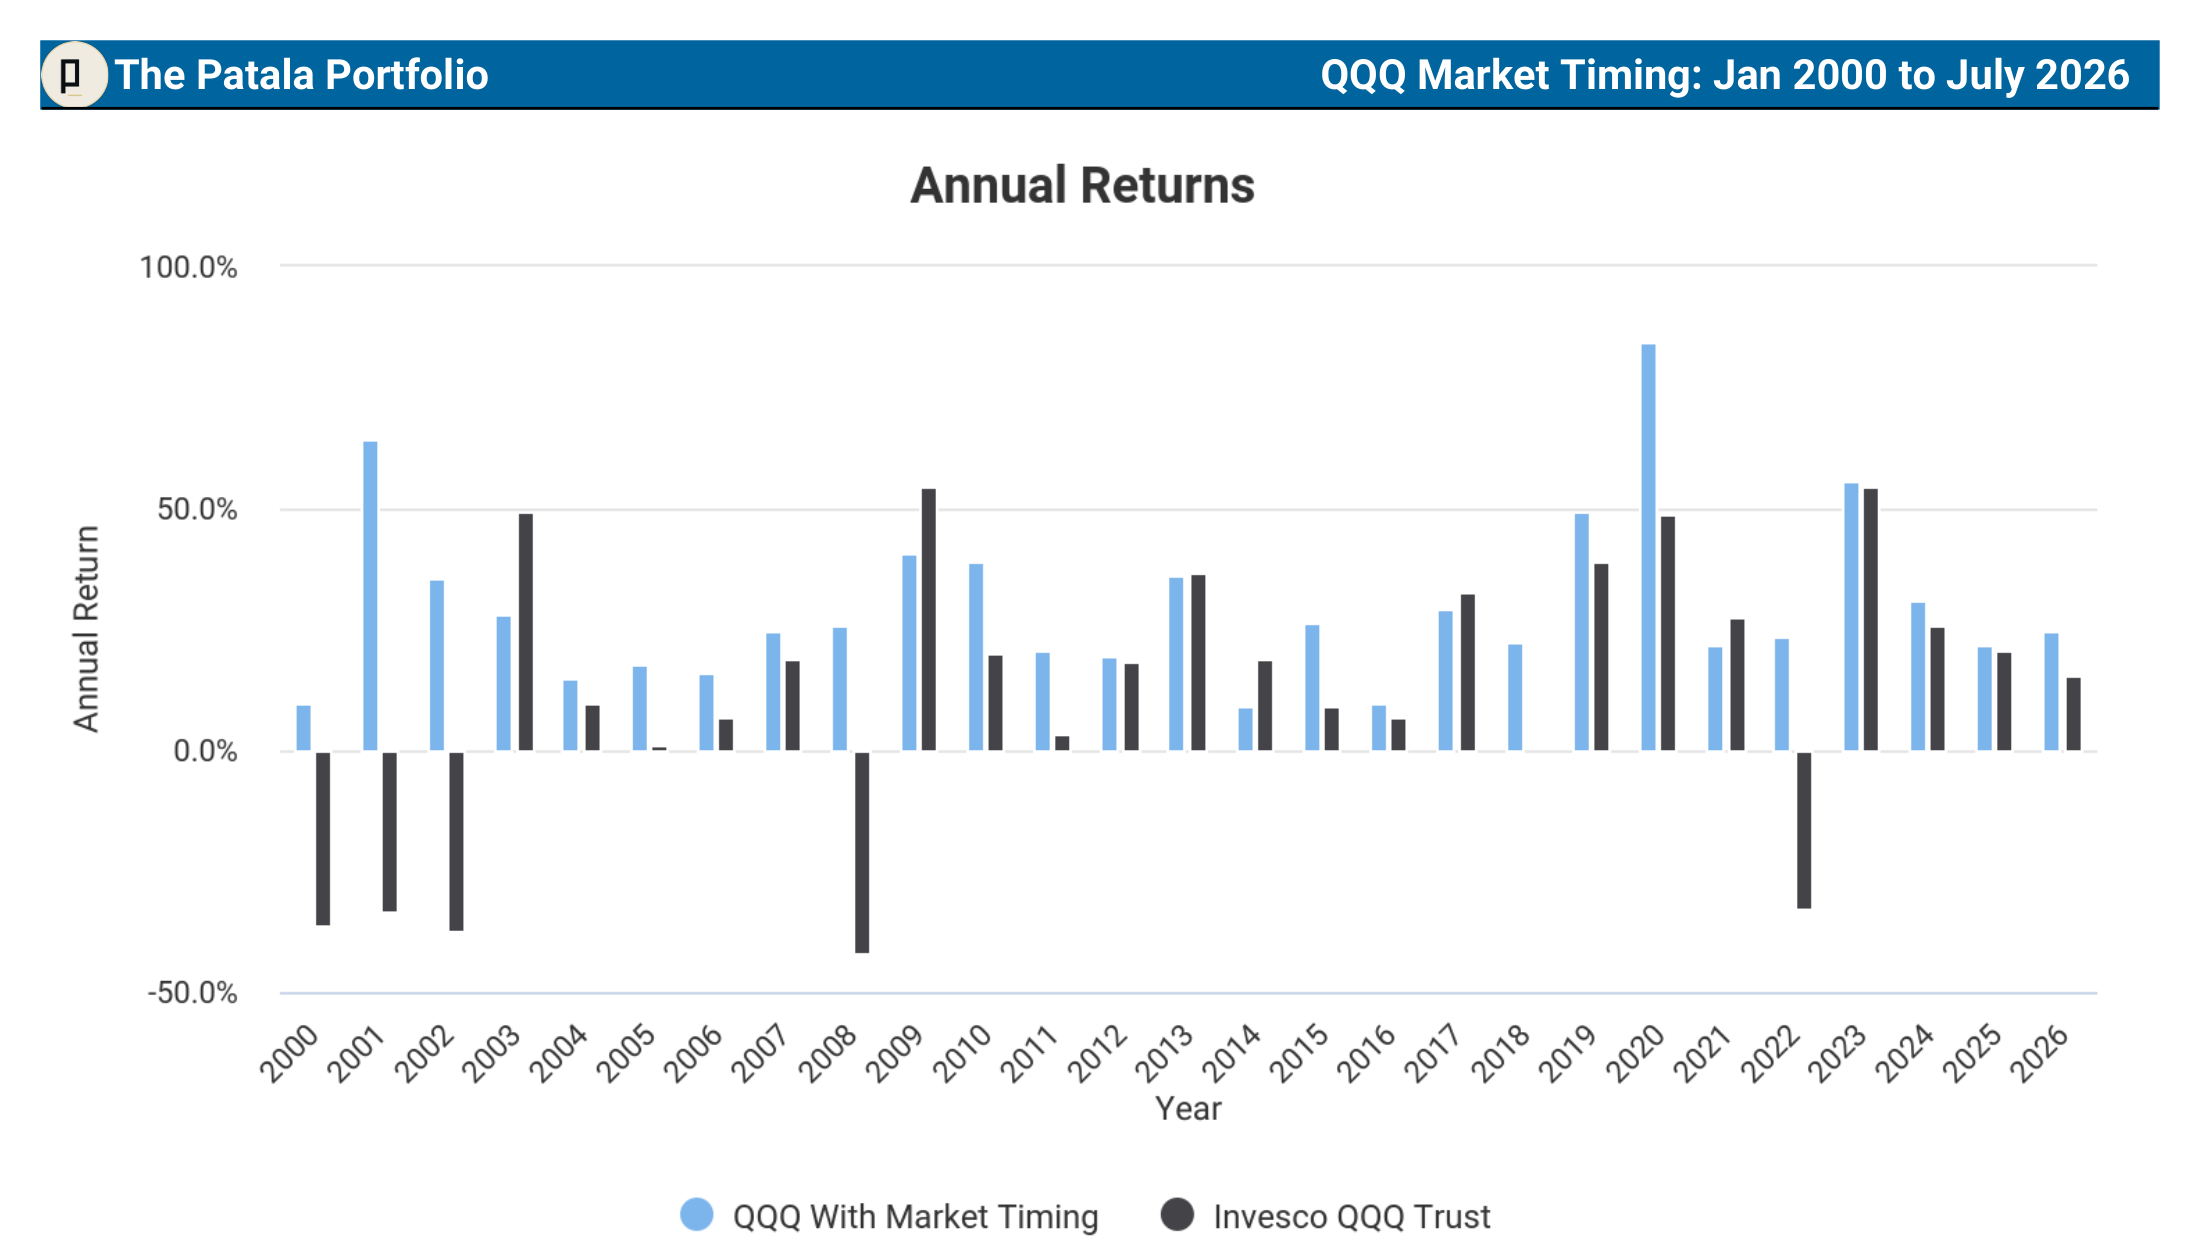
Read the worst-year line again. Over 26+ years, the signal’s worst calendar year was positive — up 9.08%. Through the dot-com crash, 2008, COVID, and 2022, it never finished a year in the red. Buy and hold had a −41.73% year.
And the risk-adjusted numbers are in a different league: a Sharpe of 1.72 versus 0.39, a Sortino of 5.43 versus 0.57. The signal delivered more than three times the return of buy and hold with lower volatility. Higher returns and lower risk at the same time — the combination that isn’t supposed to exist — comes from one simple discipline: not being invested during the worst declines.
The same system, a more powerful engine
Nothing about the method changed from the SPY post. It’s the same two-layer signal:
A macro model that makes one BUY/SELL call on the first trading day of each month.
A daily model that divides the market into 158 zones, only 11 of which trigger a SELL — so it stays invested through ordinary volatility and steps aside only for genuine danger.
The only difference is the instrument it’s applied to. On the steady S&P 500, it compounded $10K into $1.75M. On the more aggressive Nasdaq-100, that same discipline compounded into $9.2M — because there was more upside to capture and, crucially, a much deeper crash to avoid.
Which version is right for you
Across these two posts you’ve now seen the signal on the S&P 500 (steadier, −8.5% worst drawdown) and the Nasdaq-100 (higher octane, −9.97% worst drawdown, but far higher returns). Both beat buy and hold on every single risk-adjusted measure.
Want the smoothest ride, or trading inside an IRA/401(k)? SPY or an S&P 500 index fund.
Want maximum growth and can handle a more volatile index? QQQ.
Want even more aggression? The same signal works on TQQQ — but that deserves its own post, with its own serious risk warnings. It’s coming.
This is the same system, twenty years in the making, running on one daily signal. From here on I’ll publish where it stands every week, and every flip the day it happens — wins and whipsaws both. The live record starts now.
The simplest market timing signal in the world. One signal. One trade when it flips. Under five hours a year.
Disclaimer: I am not a registered investment adviser, and nothing here is personalized investment advice, a recommendation, or an offer of advisory services. This publication is for informational and educational purposes only. Performance figures are generated by Portfolio Visualizer from historical data and a backtested application of the signal; backtested results are hypothetical, have inherent limitations, and do not guarantee future results. Consult a qualified financial adviser before investing. You are solely responsible for your own decisions.
.