


NVDA was always a QuantRanks darling. Is it still, today, before earnings?
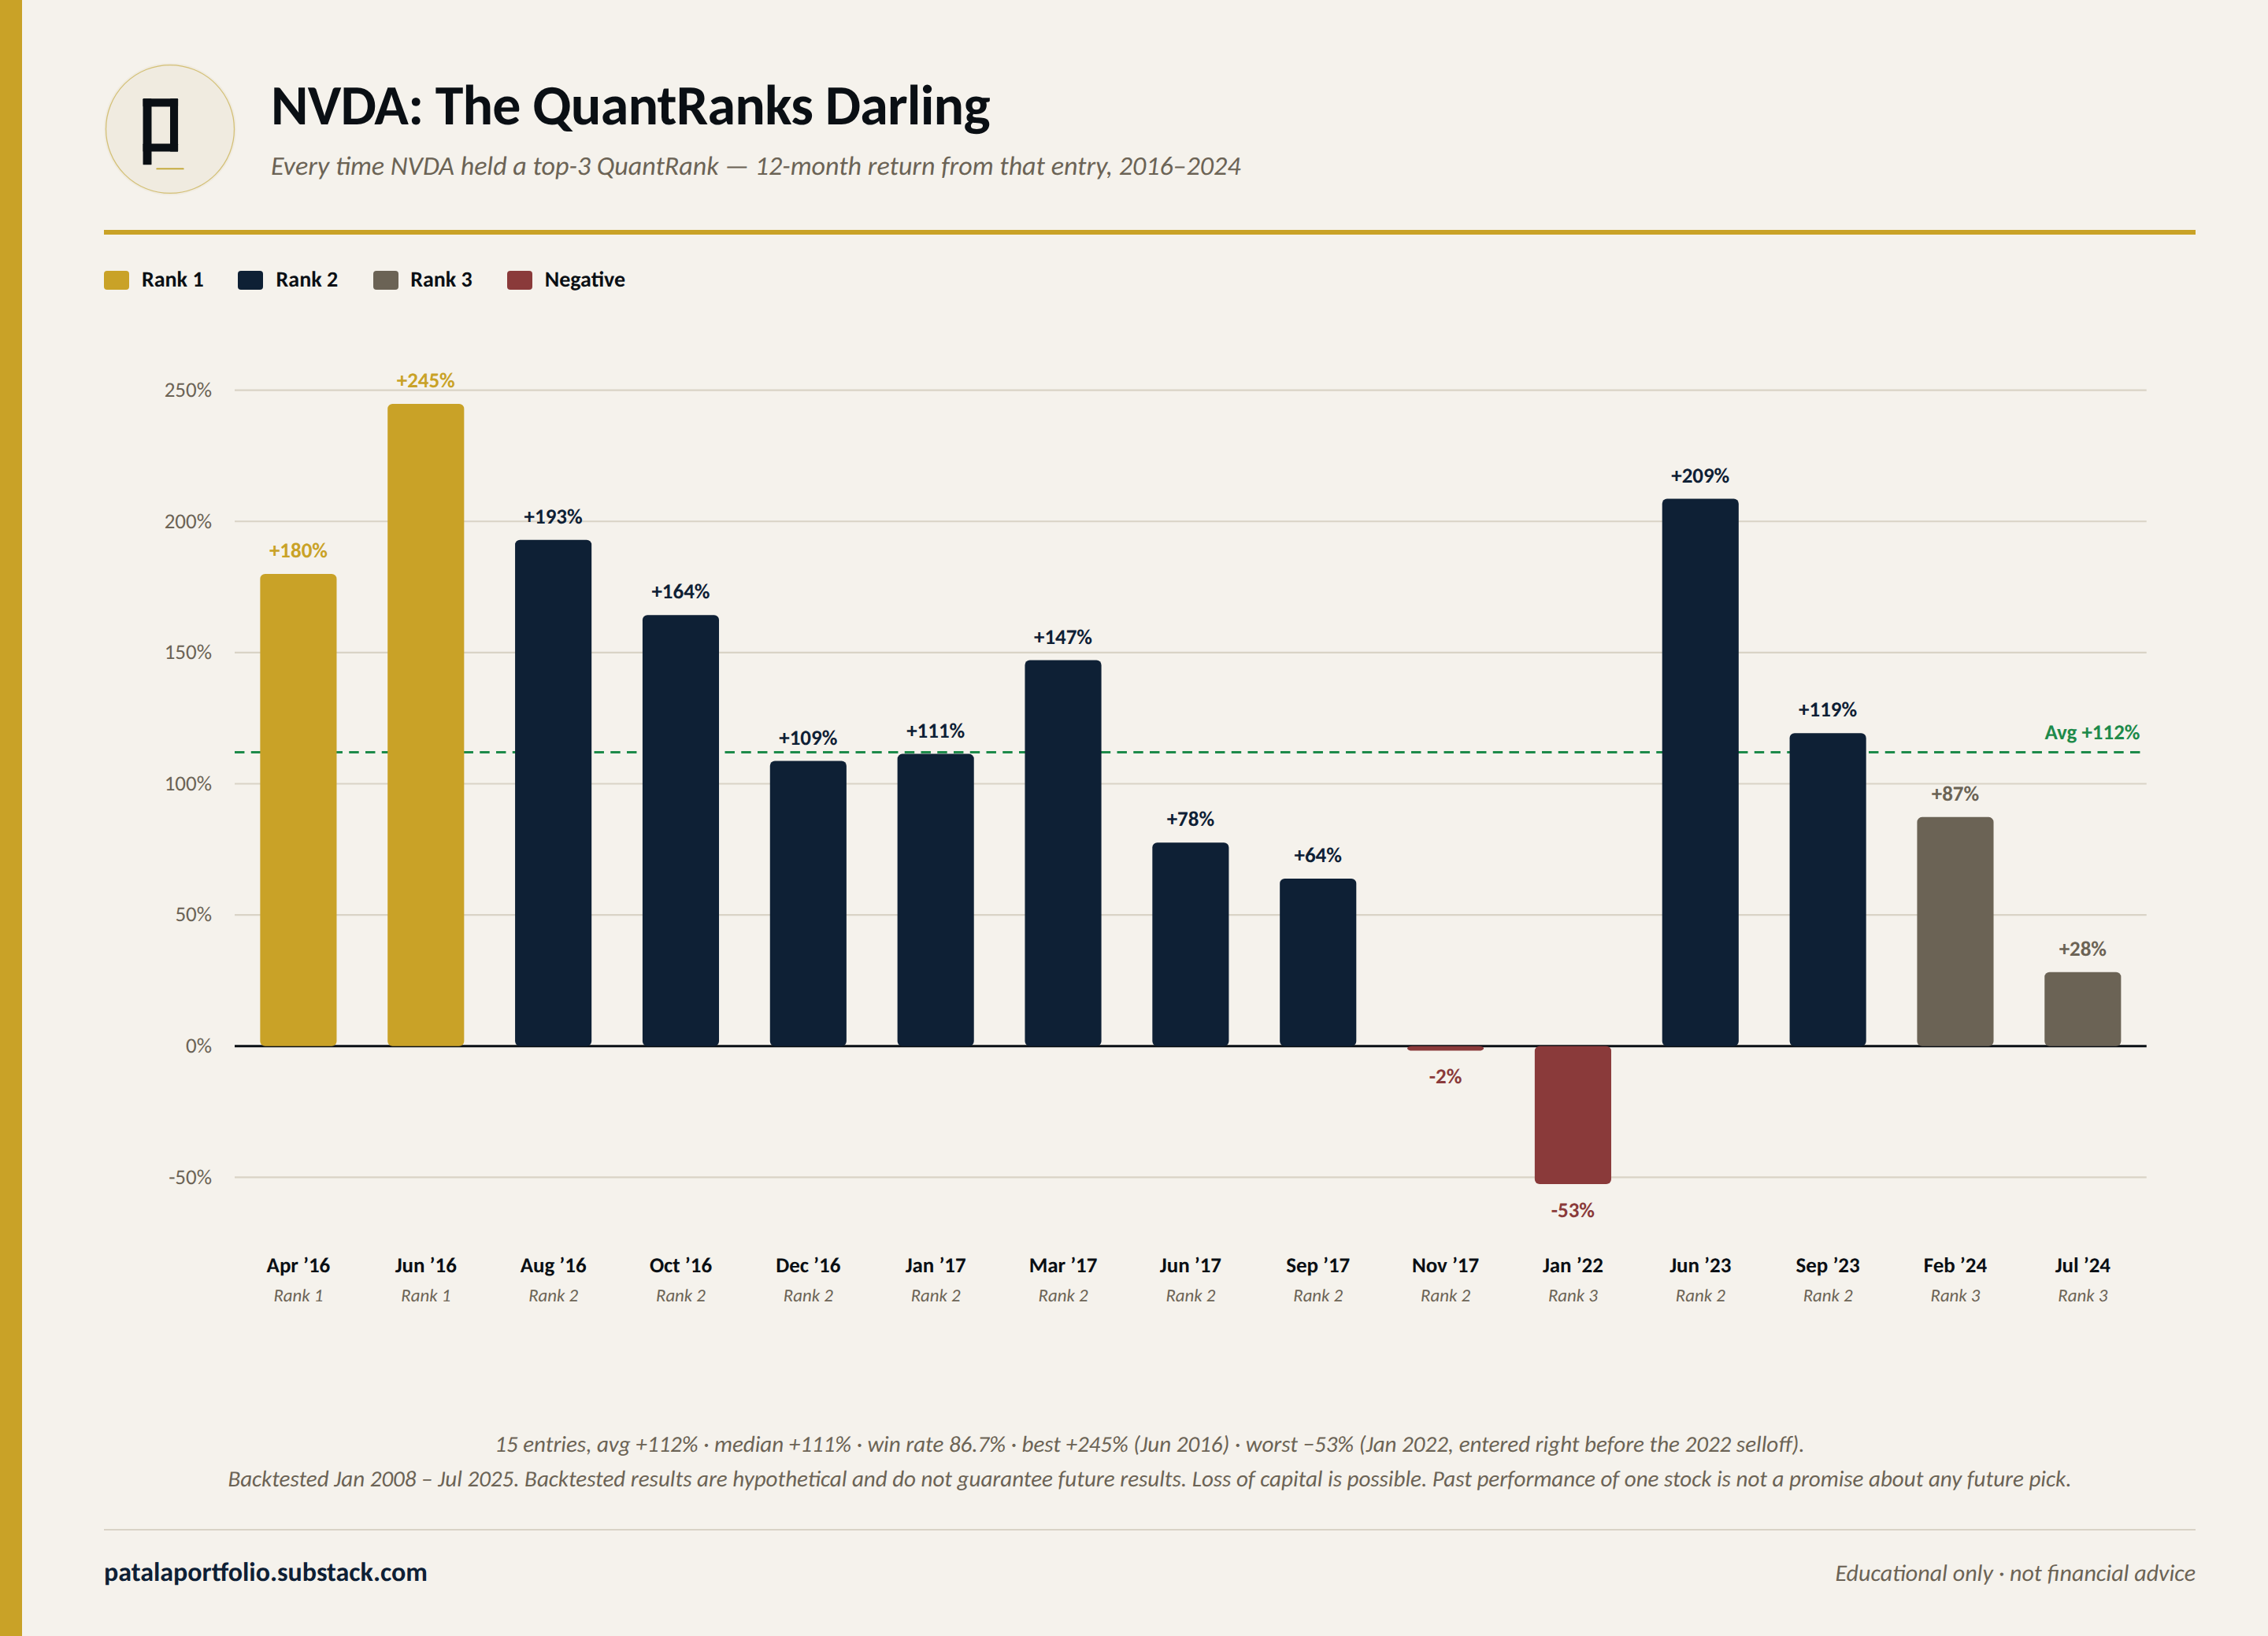
Fifteen separate times since 2016, NVDA held a top-3 QuantRank. Average return the year after: +112%. Here’s every one of those entries, in full:
Past is prologue — or is it? Keep reading.
NVIDIA reports earnings again today. A $5.16 trillion company, the most-watched print on the calendar, and every desk on the Street already has an opinion before the number even hits the tape. This is the market darling of the moment — the stock everyone already owns, everyone already believes in, and everyone already has a story about.
QuantRanks doesn’t care about any of that. It has a rank, not an opinion. Here’s the only question this newsletter actually asks: what’s NVDA’s QuantRank right now?
The snapshot
As of the August 25 close:
Price: $213.05
Market cap: $5.16T
P/E (TTM): 32.63
None of that is what decides this. Keep reading.
The answer
NVDA’s current QuantRank: 145.
Out of roughly 450 stocks scored monthly, that’s a stock that’s not in the top tier the strategy actually trades from — not a disaster, but not a standout either, on a list where “not a standout” is not the bar we’re grading against.
That’s the whole analysis, and it doesn’t depend on what NVDA reports this afternoon. A beat today doesn’t move NVDA from rank 145 into the top 20. A miss doesn’t either. The rank already reflects what the model thinks matters — earnings day is not new information to it.
Where the line actually is
I buy ranks 1 through 5. Every week, no exceptions — except one: when my SPY market-timing signal is a SELL, there’s no pick that week at all, top-5 rank or not. Capital goes to cash, full stop. The rank only matters when the signal already says the market’s worth being in.
Subscribe to get the top QuantRanks stocks I buy every Monday
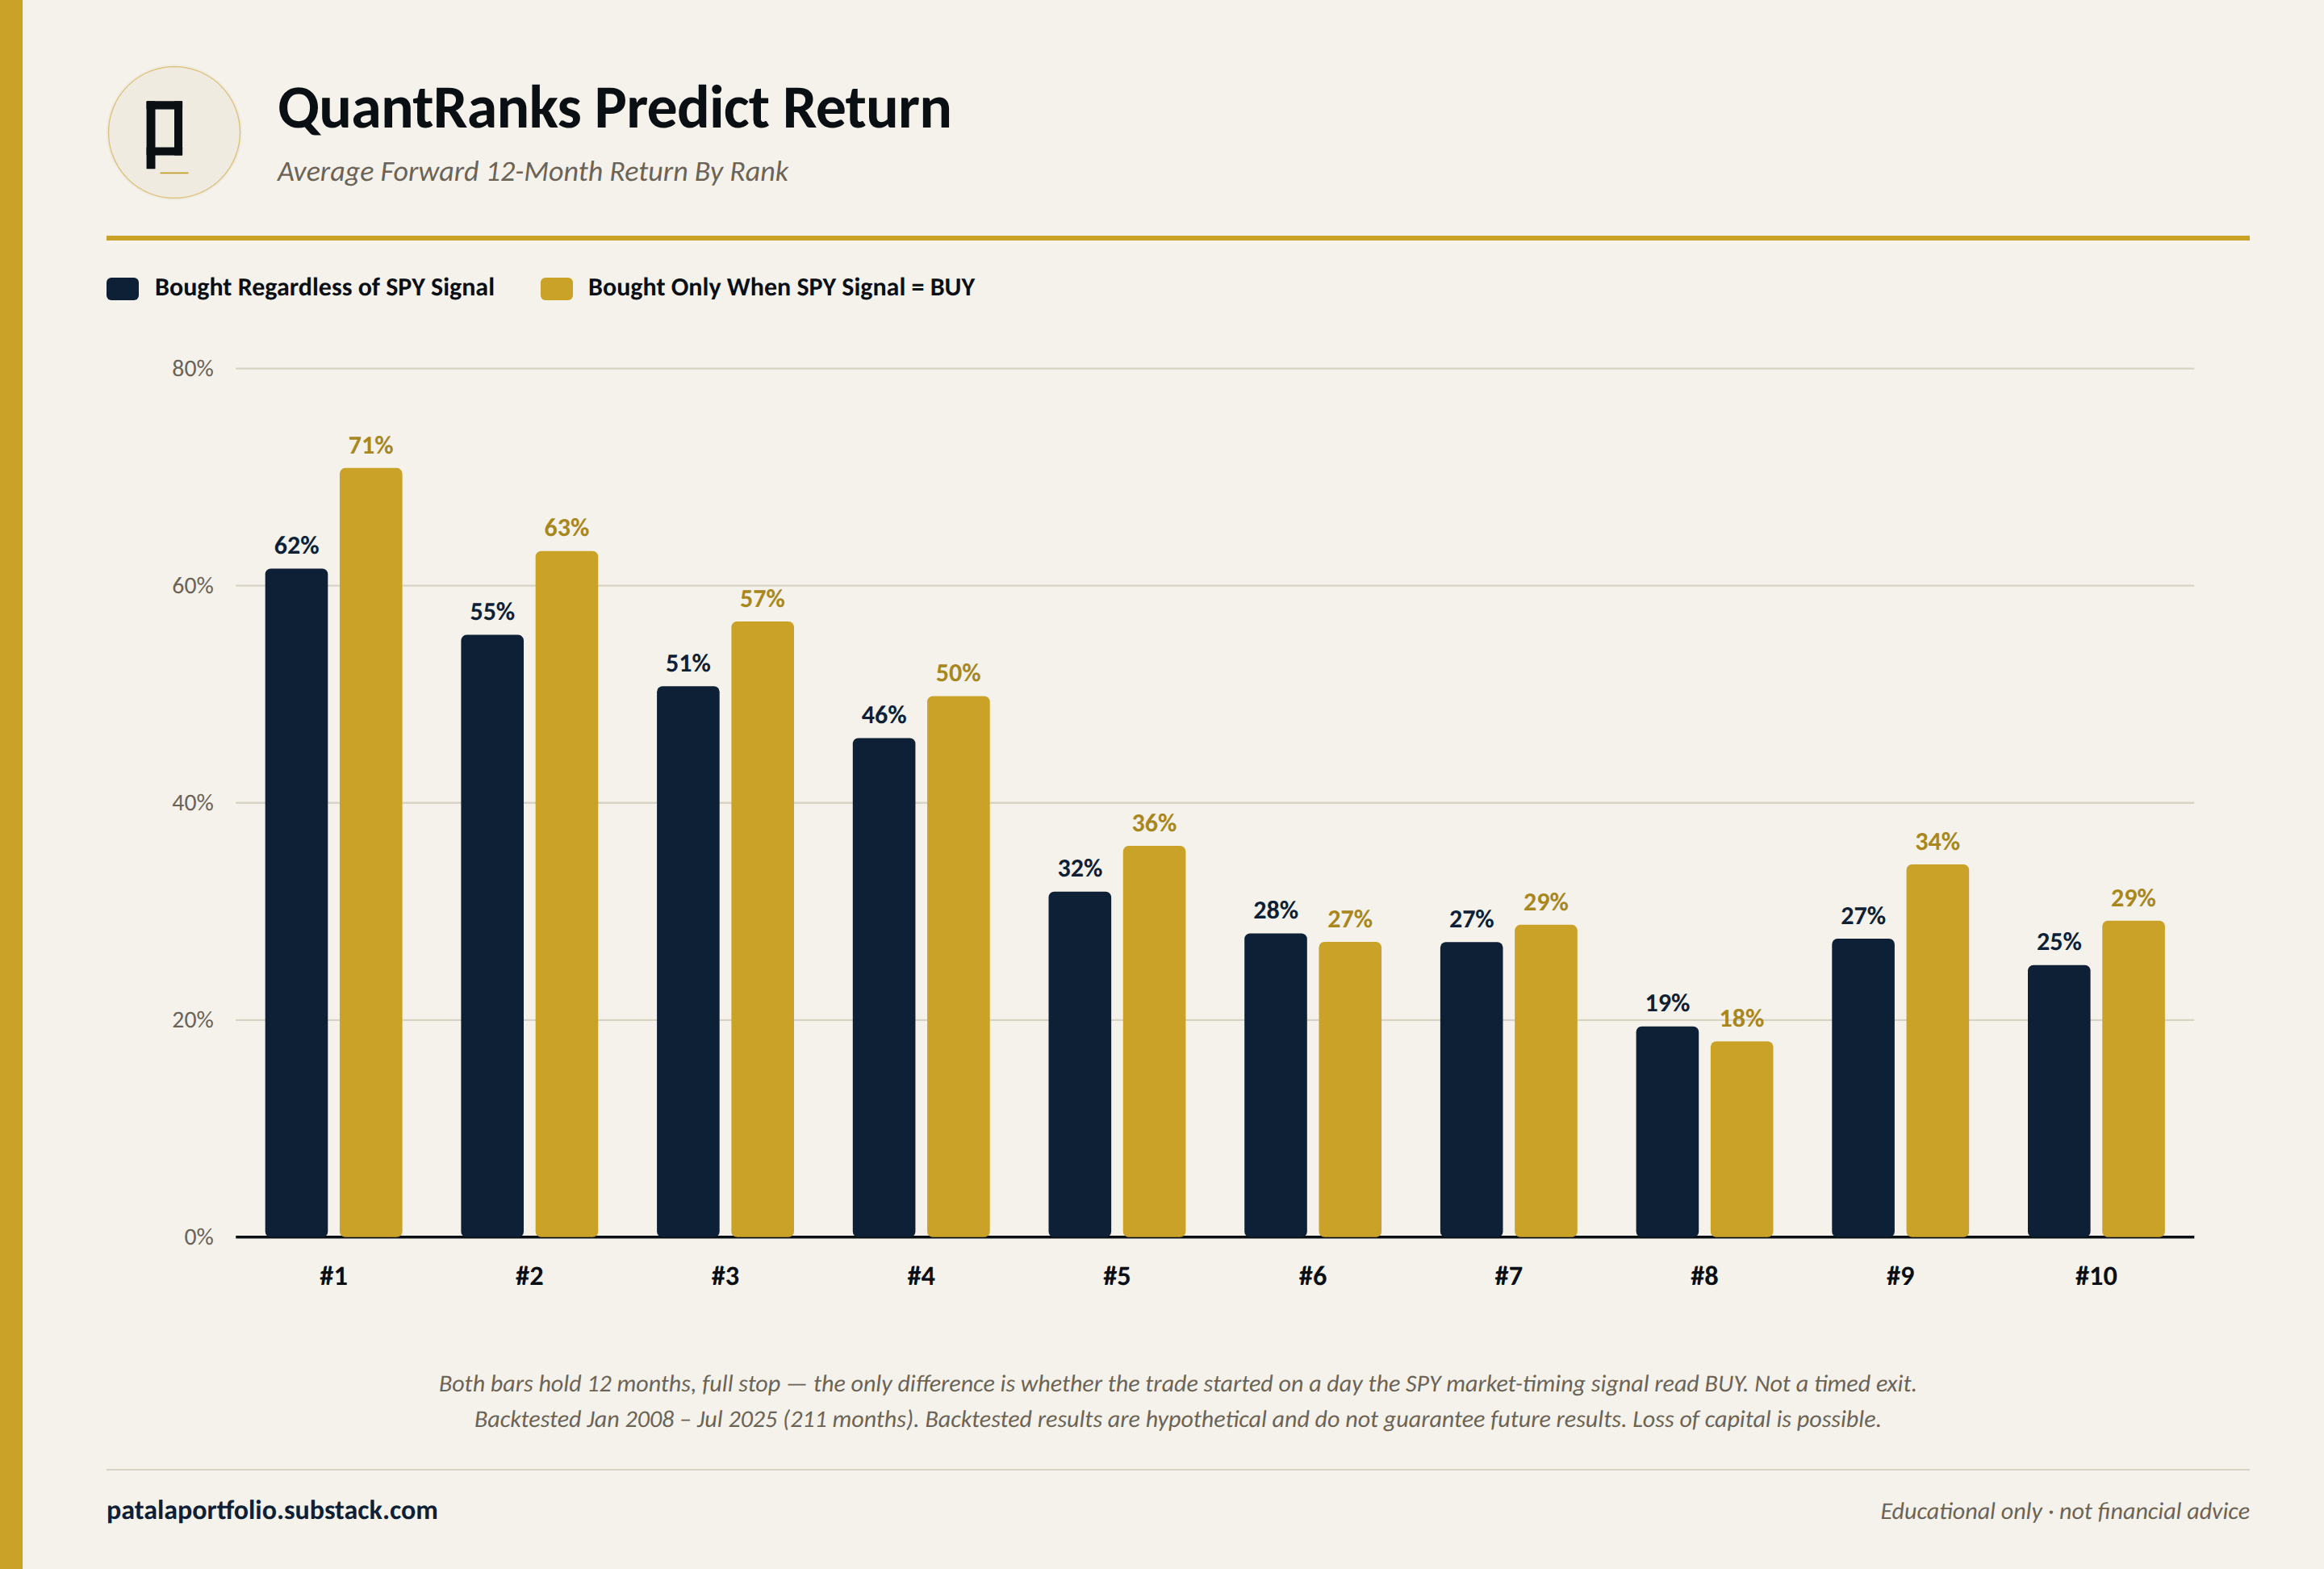
The backtest doesn’t just support that top five, though — it supports a wider tier than most people would guess, and it draws a real, visible line at exactly where that tier ends.
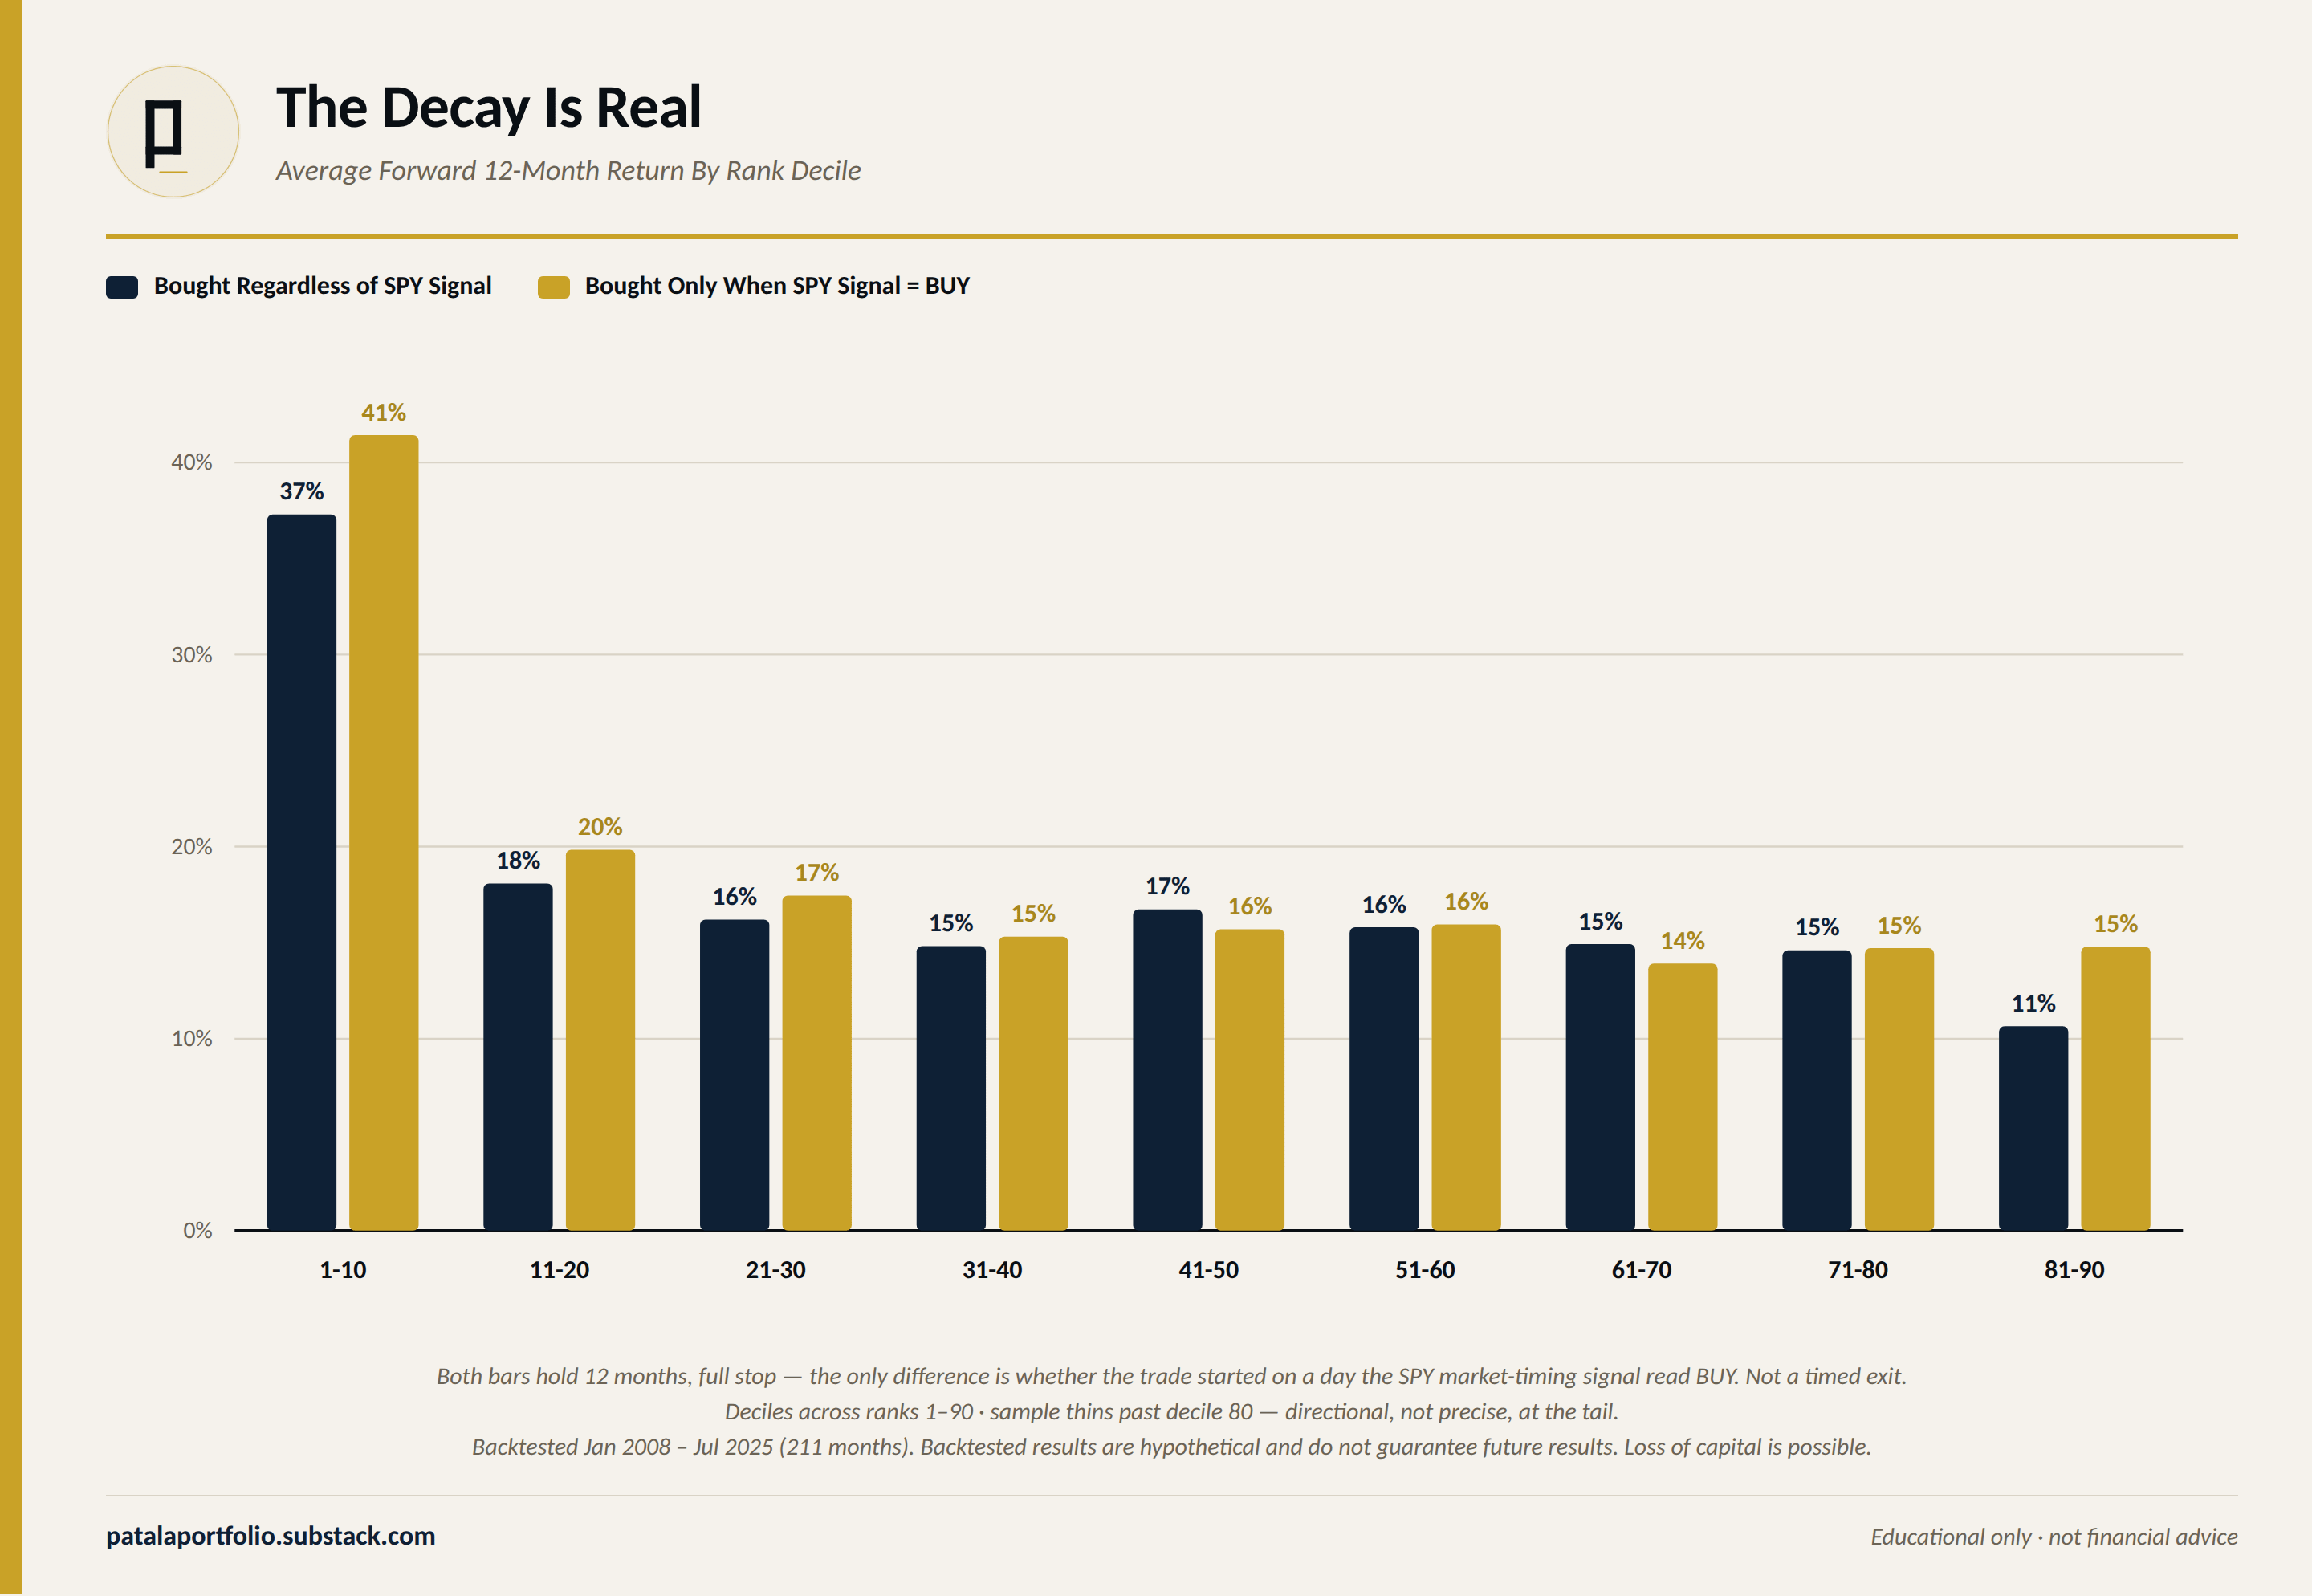
Ranks 1 through 10 — the top decile — averaged 37% to 41% over the following 12 months in the backtest. Ranks 11 through 20 look nothing like that: roughly 18% to 20%, statistically indistinguishable from ranks 30, 50, or 70. The cliff isn’t gradual. It happens once, right at the edge of the top ten, and then the line goes flat for the rest of the list.
So the honest rule is: ranks 6 through 10 are worth a genuine look — still inside the tier the data actually supports. Ranks 11 through 20 are a stretch I wouldn’t lean on. Past 20, a stock isn’t in this conversation at all. NVDA, at 145, isn’t within shouting distance of any of those thresholds — it’s not a bottom-of-the-barrel name, it’s just nowhere near the top tier the strategy actually trades.
Why concentration matters this much
This isn’t just a Patala finding. It’s one of the most replicated results in long-run market research.
Hendrik Bessembinder’s landmark study of nearly every U.S. stock since 1926 found that just 4% of stocks accounted for all the net wealth the stock market has ever created above cash — everything else, in aggregate, merely matched T-bills. His most recent update, covering a full century of data, found the concentration has only gotten tighter: 89 firms once accounted for half of the market’s $43 trillion in net wealth creation; the latest data puts that number at just 46 firms, even as total wealth creation more than doubled to $91 trillion. Widen the lens to global markets and the pattern holds — one large-scale study puts the top-performing 2.4% of firms worldwide behind effectively all $75.7 trillion in net global wealth creation from 1990 to 2020.
The lesson isn’t “buy 4% of the market and ignore the rest” — nobody can identify those names in advance with certainty, which is exactly why broad indexing works as a baseline. But it’s a real, data-backed reason why a systematic tilt toward a tiny, well-defined top tier — not the top half, not “good enough,” but the actual top of the list — is where a stock-picking edge would have to live if it exists at all. QuantRanks’ own backtest shows the same shape at a smaller scale: a real cliff at the very top, then a long flat plateau where extra selectivity stops paying off. NVDA, sitting well down that 450-stock list, is precisely that flat plateau. Being the market darling doesn’t move it off that plateau. Statistically, it’s no different from a coin flip against cash, not because it’s a bad company, but because “average” is what the plateau looks like, no matter how good the story is.
Verdict
Not a buy — based on the rank, not the earnings print.
If NVDA’s rank ever climbs into the top 10, it’s worth a second look. Into the top five, it’s a QuantRank pick, same as any other stock. At 145, it’s not close to either — beat or miss this afternoon, that doesn’t change.
The darling of 2016 through 2024 isn’t the darling of this list today. That’s not a knock on NVDA — it’s what the rank is for.
This is one check on one stock, not a general recommendation. It’s the same mechanical answer the model would give about any ticker, on any day, using the same rank it already publishes. Full method: The Patala Core-Plus Strategy.
Every Sunday at 6:00 am ET, free. Subscribe here for the weekly QuantRank pick.
Disclaimer: Educational and informational only. Not personalized investment advice, and not a recommendation to buy or sell any security. I am not a registered investment adviser. Past performance — backtested or live — does not guarantee future results. You can lose money, including a substantial amount. Consult a qualified financial adviser before investing.
The NVIDIA name and logo are trademarks of NVIDIA Corporation. Their use here is for identification purposes only and does not imply endorsement or affiliation.