
What the heck just happened this week?
Let’s start with the honest recap, because this was one for the record books.
It was, by almost any measure, the roughest week since the launch of this newsletter — and a genuine stress test for any systematic approach:
Semiconductors crashed, dragging down the AI complex that has led this entire bull market.
The KOSPI sold off hard earlier in the week, sending a risk-off wave across global markets.
Retail investors dumped single stocks at the fastest pace since COVID — the kind of capitulation that usually marks peak fear, not calm.
The Fed meeting injected its usual dose of two-way volatility.
And Leopold Aschenbrenner’s hedge fund blew up — a high-profile, high-flying fund unwinding in a very public way, exactly the sort of headline that makes everyone assume the dominoes are starting to fall.
Turn on any screen last week and the message was the same: the top is in.
And then — as it so often does right when the panic peaks — the market recovered strongly into the back half of the week. SPY dipped to $729 on Wednesday and closed Friday back at $747.03, essentially flat on the week after all that drama.
Where the signal stands
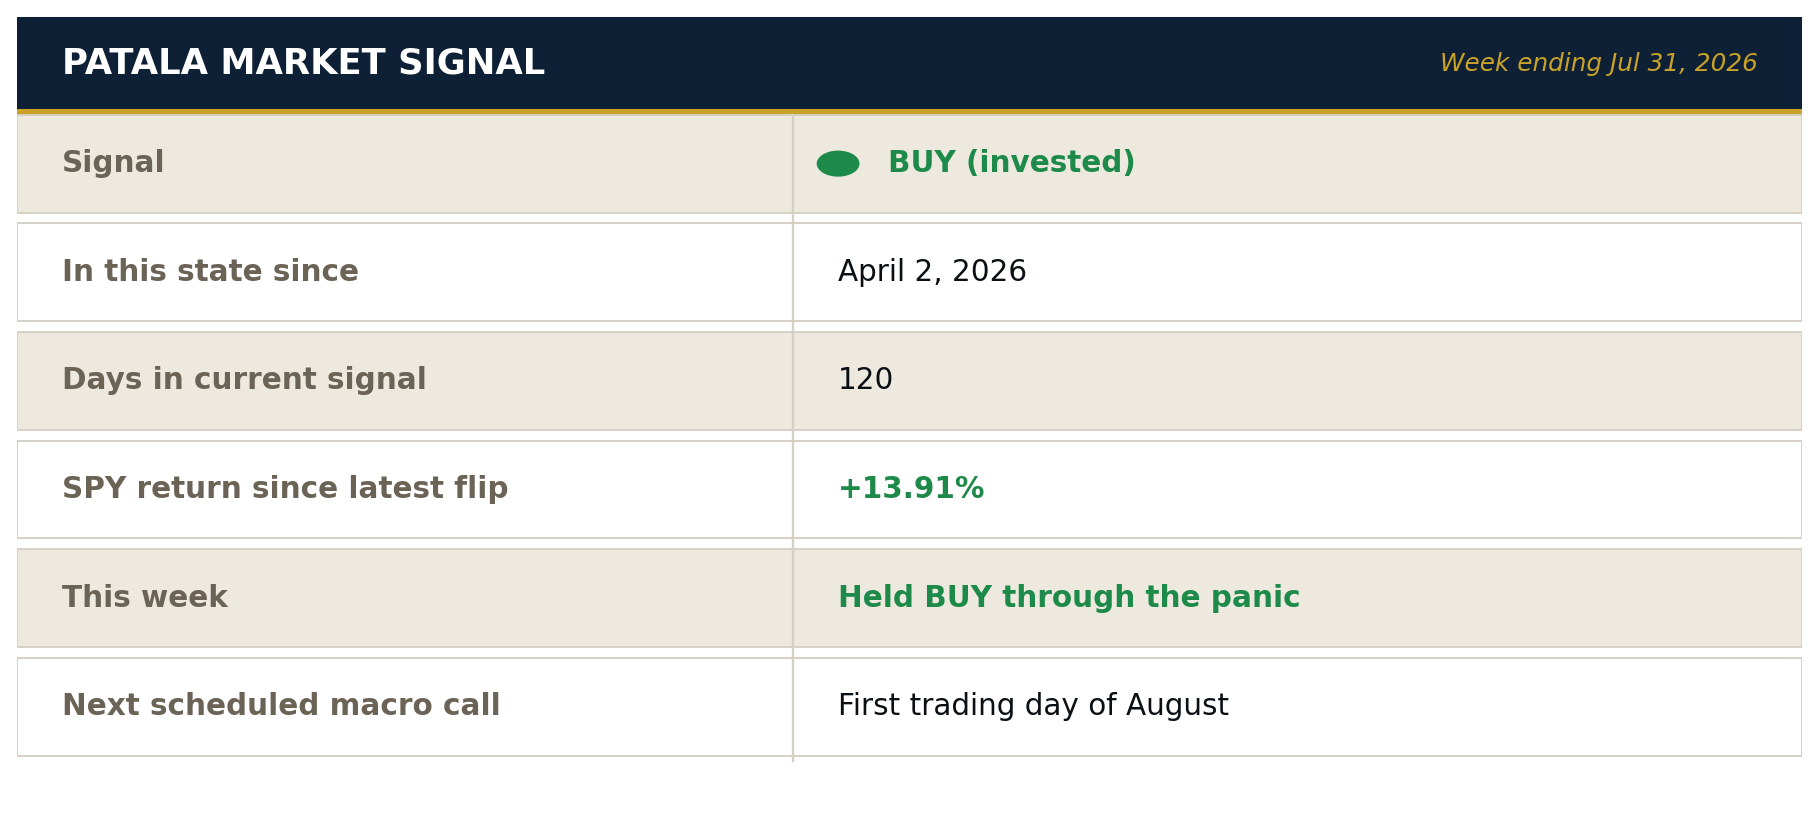
Through all of it, the Patala signal stayed a BUY. It never budged.
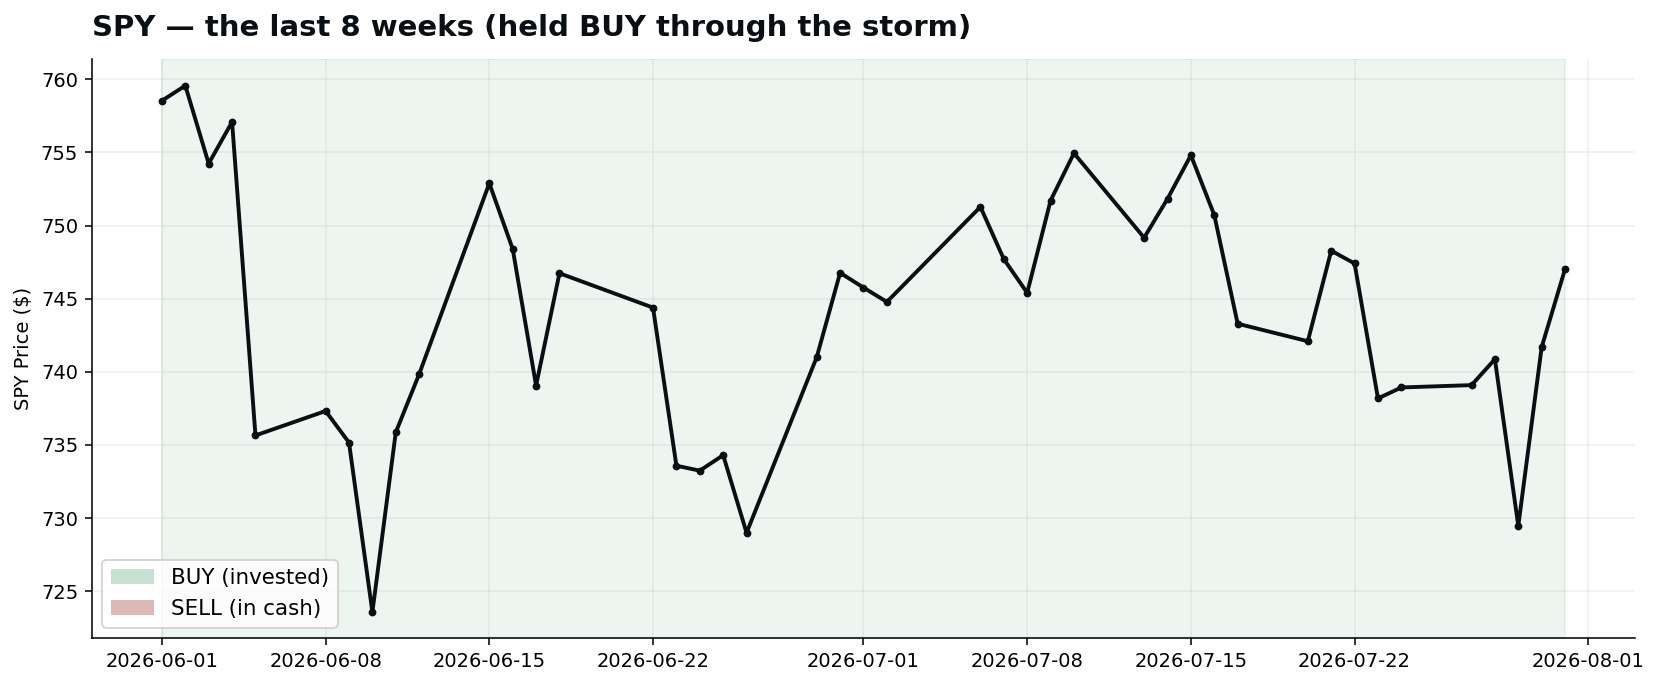
Look at that eight-week chart. The sharp dip on July 29 is the panic — the moment the headlines screamed loudest. The signal held green straight through it. It has been a continuous BUY since April 2 — 120 days now — and through this week’s turbulence, the model never wavered.
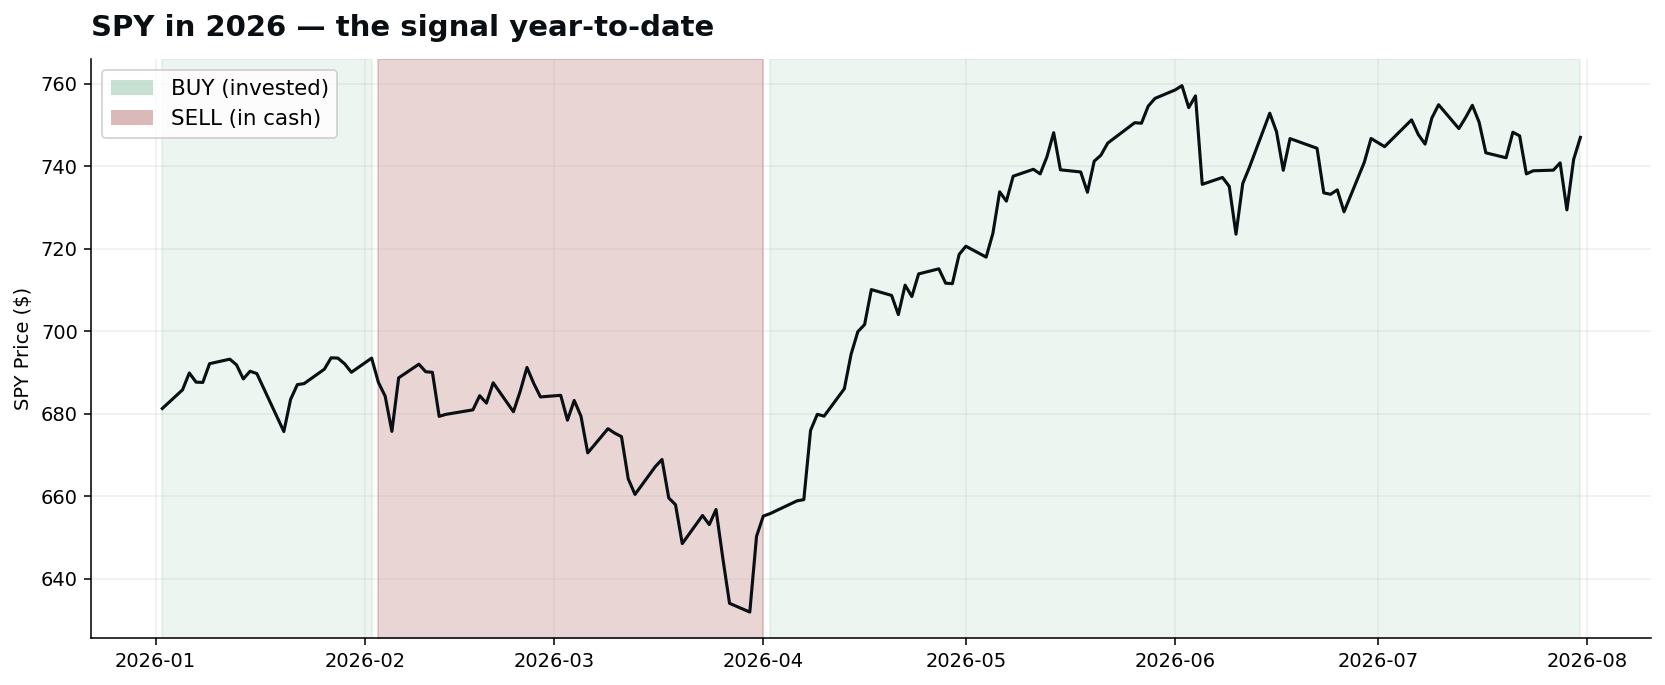
Here’s the full year for context — the February SELL that sidestepped the March drawdown, the April re-entry near the lows, and the long hold since:
Why this week mattered more than most
I want to be honest about something: this is the exact kind of week 20+ years of research and 26+ years of backtesting were built for.
Not the calm weeks. The scary ones.
Anyone can hold when markets are rising and the news is good. The entire value of a system reveals itself in weeks like this one — when semis are crashing, a famous fund is imploding, retail is puking stocks, and every instinct in your body is screaming get out before it gets worse.
The gut wanted out. The model held. And holding — at least so far — was right.
Not because I’m brave. Not because I “called it.” Because the model doesn’t trade on fear or headlines. It reads the market’s actual behavior, and despite all the noise, price action never entered the danger zones that would flip it to cash. Remember the mechanics: out of 158 daily zones, only 11 trigger a SELL. This week rattled the cage hard, but never quite tripped the wire.
Guidance for the week ahead
Here’s where discipline matters more than opinion.
The signal is a BUY, so the system says stay invested. But note that the next scheduled macro call lands on the first trading day of August — this coming week. That’s the model’s monthly checkpoint, and after a week this volatile, it’s worth watching closely.
My guidance: hold your positions and let the model do its job. If you were tempted to panic-sell into Wednesday’s dip, this week is the lesson — the investors who dumped at the fastest pace since COVID were selling near the lows of the week, right before the recovery. That is precisely the behavior a rules-based system exists to protect you from.
As always: this is not investment advice, and I’m not telling you what to do with your money. What I can tell you is what the discipline of the system calls for — follow the signal, don’t front-run the macro call, and don’t let a terrifying week talk you into a trade the model never asked for. The whole 26-year edge comes from doing what the signal says and nothing more.
The bigger picture: this is what “staying invested” looks like over time
Weeks like this feel unprecedented in the moment. They rarely are. Here’s the signal on SPY over the last 10 years — green means invested, red means in cash.
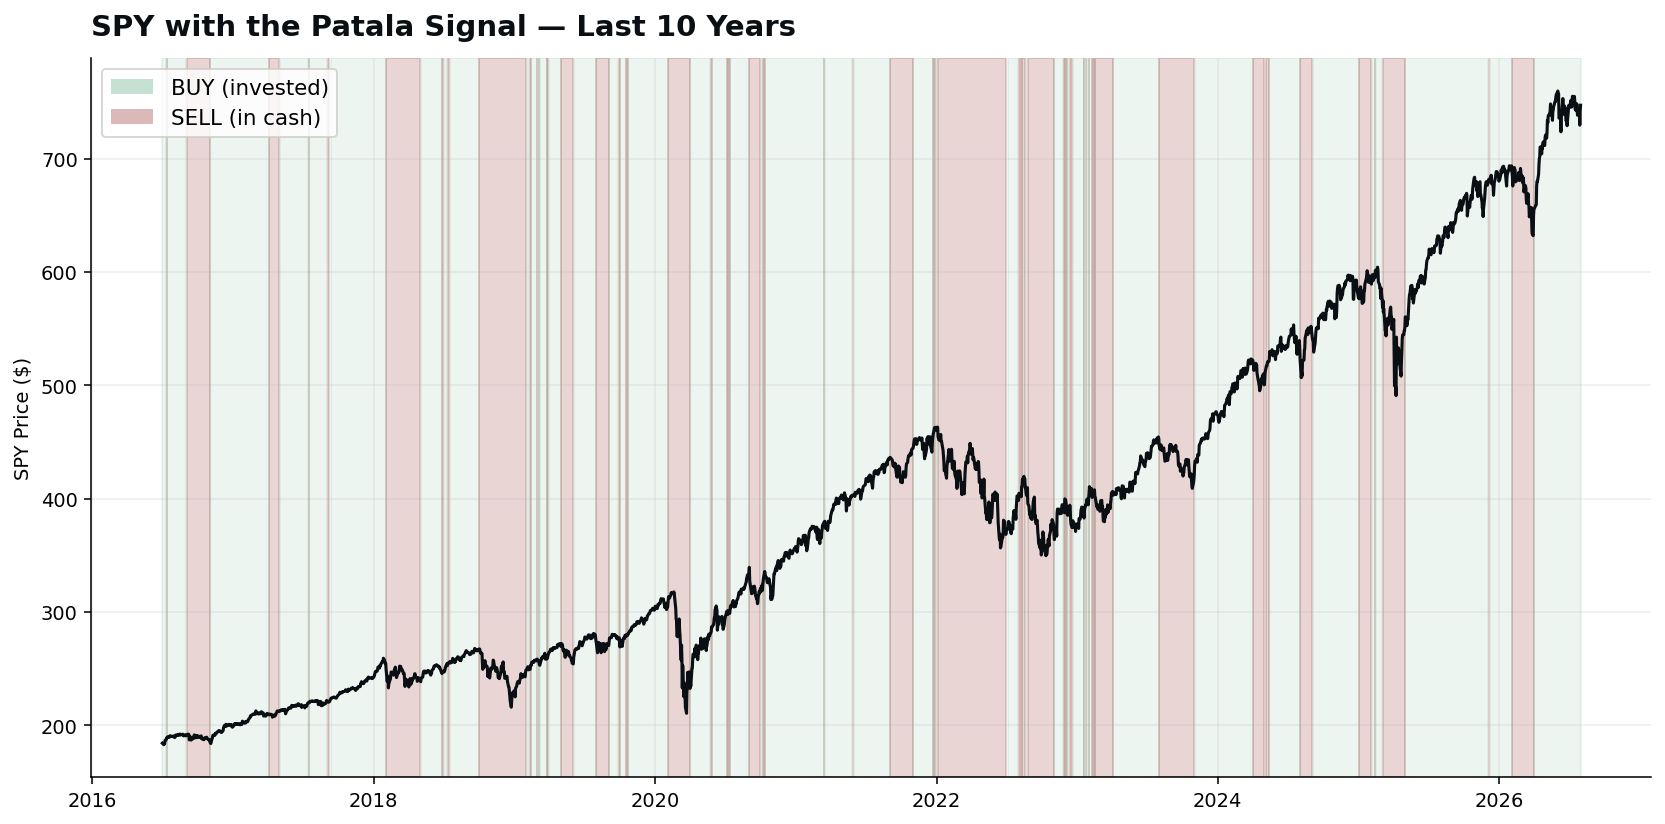
Find 2020 on that chart. Find the 2022 bear market. The red bands cluster exactly where the real damage happened — and notice how much green there is everywhere else. The system spends most of its life invested, riding the trend, stepping aside only for genuine danger. This week looked scary, but on a 10-year view it’s a blip. The discipline is in knowing the difference.
The last 10 flips
Full transparency, as always — every confirmed flip, with the SPY move captured or avoided during each:
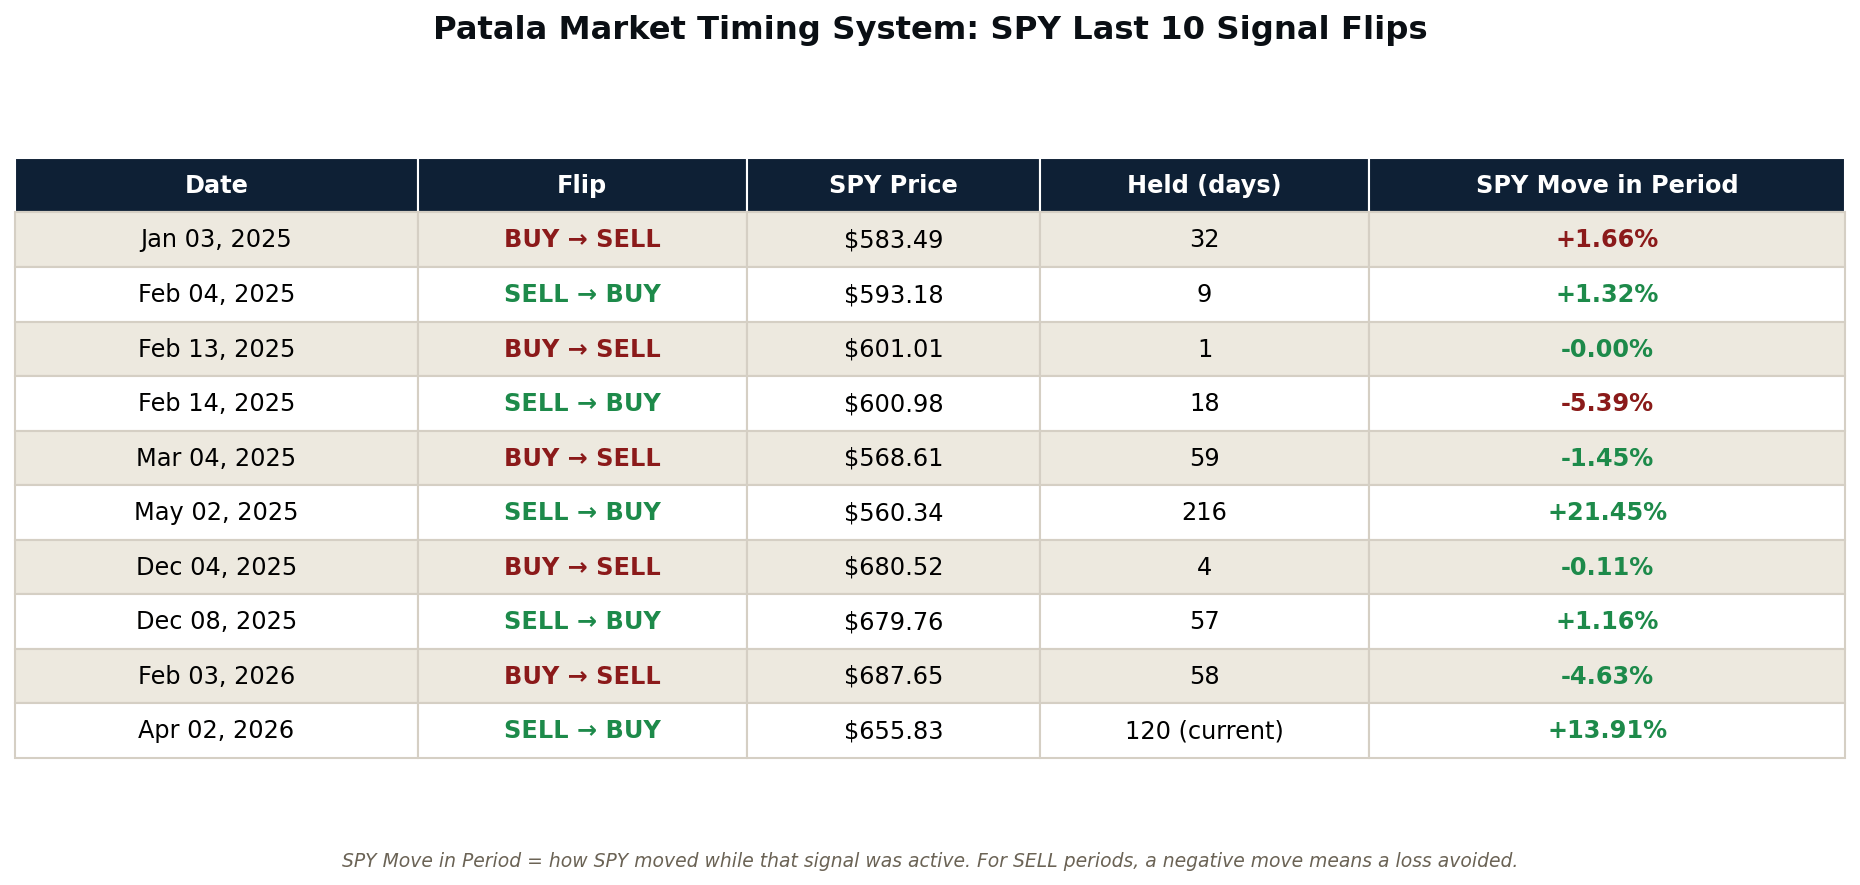
A few honest observations:
The current BUY has held since April 2 — 120 days — and is up +13.9%. The long holds are where the system makes its money, and this is one of them.
The whipsaws are in there too — look at the 1-day SELL in Feb 2025. We publish every confirmed flip, wins and losses both. That’s the deal.
This week isn’t in the table because the signal didn’t flip — and that’s the whole point. The best weeks for a timing system are often the ones where it does nothing at all.
Full update next weekend. Until then — and especially after a week like this — stay disciplined.
Disclaimer: This is not investment advice or a recommendation, and I am not a registered investment adviser. This publication is for informational and educational purposes only. The signal reflects a backtested and now live-tracked quantitative model; past performance, backtested or live, does not guarantee future results. Markets involve risk, including loss of capital. Consult a qualified financial adviser before investing. You are solely responsible for your own decisions.