

Every Sunday I publish one stock: the top QuantRank for that week. You’ve seen the pick. This article is the part behind it — the backtest that tells me the rank is worth following in the first place.
No live pick here. Just the evidence, laid out plainly, with the caveats that belong next to it.
A note on scope: the Core-Plus strategy article deliberately keeps rank numbers, rank ordering, and per-rank performance out of it — that piece introduces the system, not the model’s internals. This article is the dedicated place for that detail. If you haven’t read Core-Plus yet, start there for the full method; come back here for the evidence behind the ranking itself.
The question
QuantRanks scores a universe of about 450 stocks — mostly S&P 500 constituents, plus some names outside the index — and re-ranks the entire list every month. Rank 1 is the model’s top pick that month. Rank 450 is the bottom.
Run monthly from January 2008 through July 2025 — the last starting month with a full 12 months of forward data to test against, given the price history runs through July 2026 — that’s:
450 stocks × 211 months = nearly 95,000 stock-months scored.
(This window runs through July 2025, a year shorter than the Core-Plus strategy article’s backtest, which goes through July 2026. That’s not a discrepancy — the Core-Plus numbers are a running equity curve that can use every day of price history available. This backtest needs each entry to have a full 12 months of future price data to grade it, so the last usable starting month is 12 months before the data runs out.)
The question this article answers: across all of that, does a lower rank number actually predict a better return? Not just for the famous winners — for the whole distribution.
How the test works
Every ranked stock gets tracked five ways: a market-timing exit (more on that below), and fixed 1-month, 3-month, 6-month, and 12-month holds. This piece focuses on the 12-month numbers, since that’s the cleanest read on whether the rank itself has staying power.
Two versions of every number appear below — both are 12-month holds, full stop. The only difference is which trades are counted:
Buy & Hold — every trade, bought regardless of what the market-timing signal was doing that day.
SPY Market Signal — the same fixed 12-month hold, but counted only for trades that started on a day the market-timing signal (the one that governs the Core-Plus strategy) read BUY. Trades that started when the signal was already unfavorable are excluded from this column.
To be clear: neither column is a timed exit. Both hold the full 12 months. Showing both just lets you see whether the market backdrop at entry matters, separate from the stock pick itself.
One data-cleaning rule, applied throughout: trades where the market signal was already unfavorable on the entry day were excluded from the SPY Market Signal numbers — those would have exited the same day under the actual Core-Plus rules and are zero-return by construction, which would understate this column’s real effect. Buy & Hold numbers use the full trade set regardless.
Ranks 1 through 10 — the names you’d actually buy
This is the tier the weekly pick comes from. Individual performance, 12-month average return:
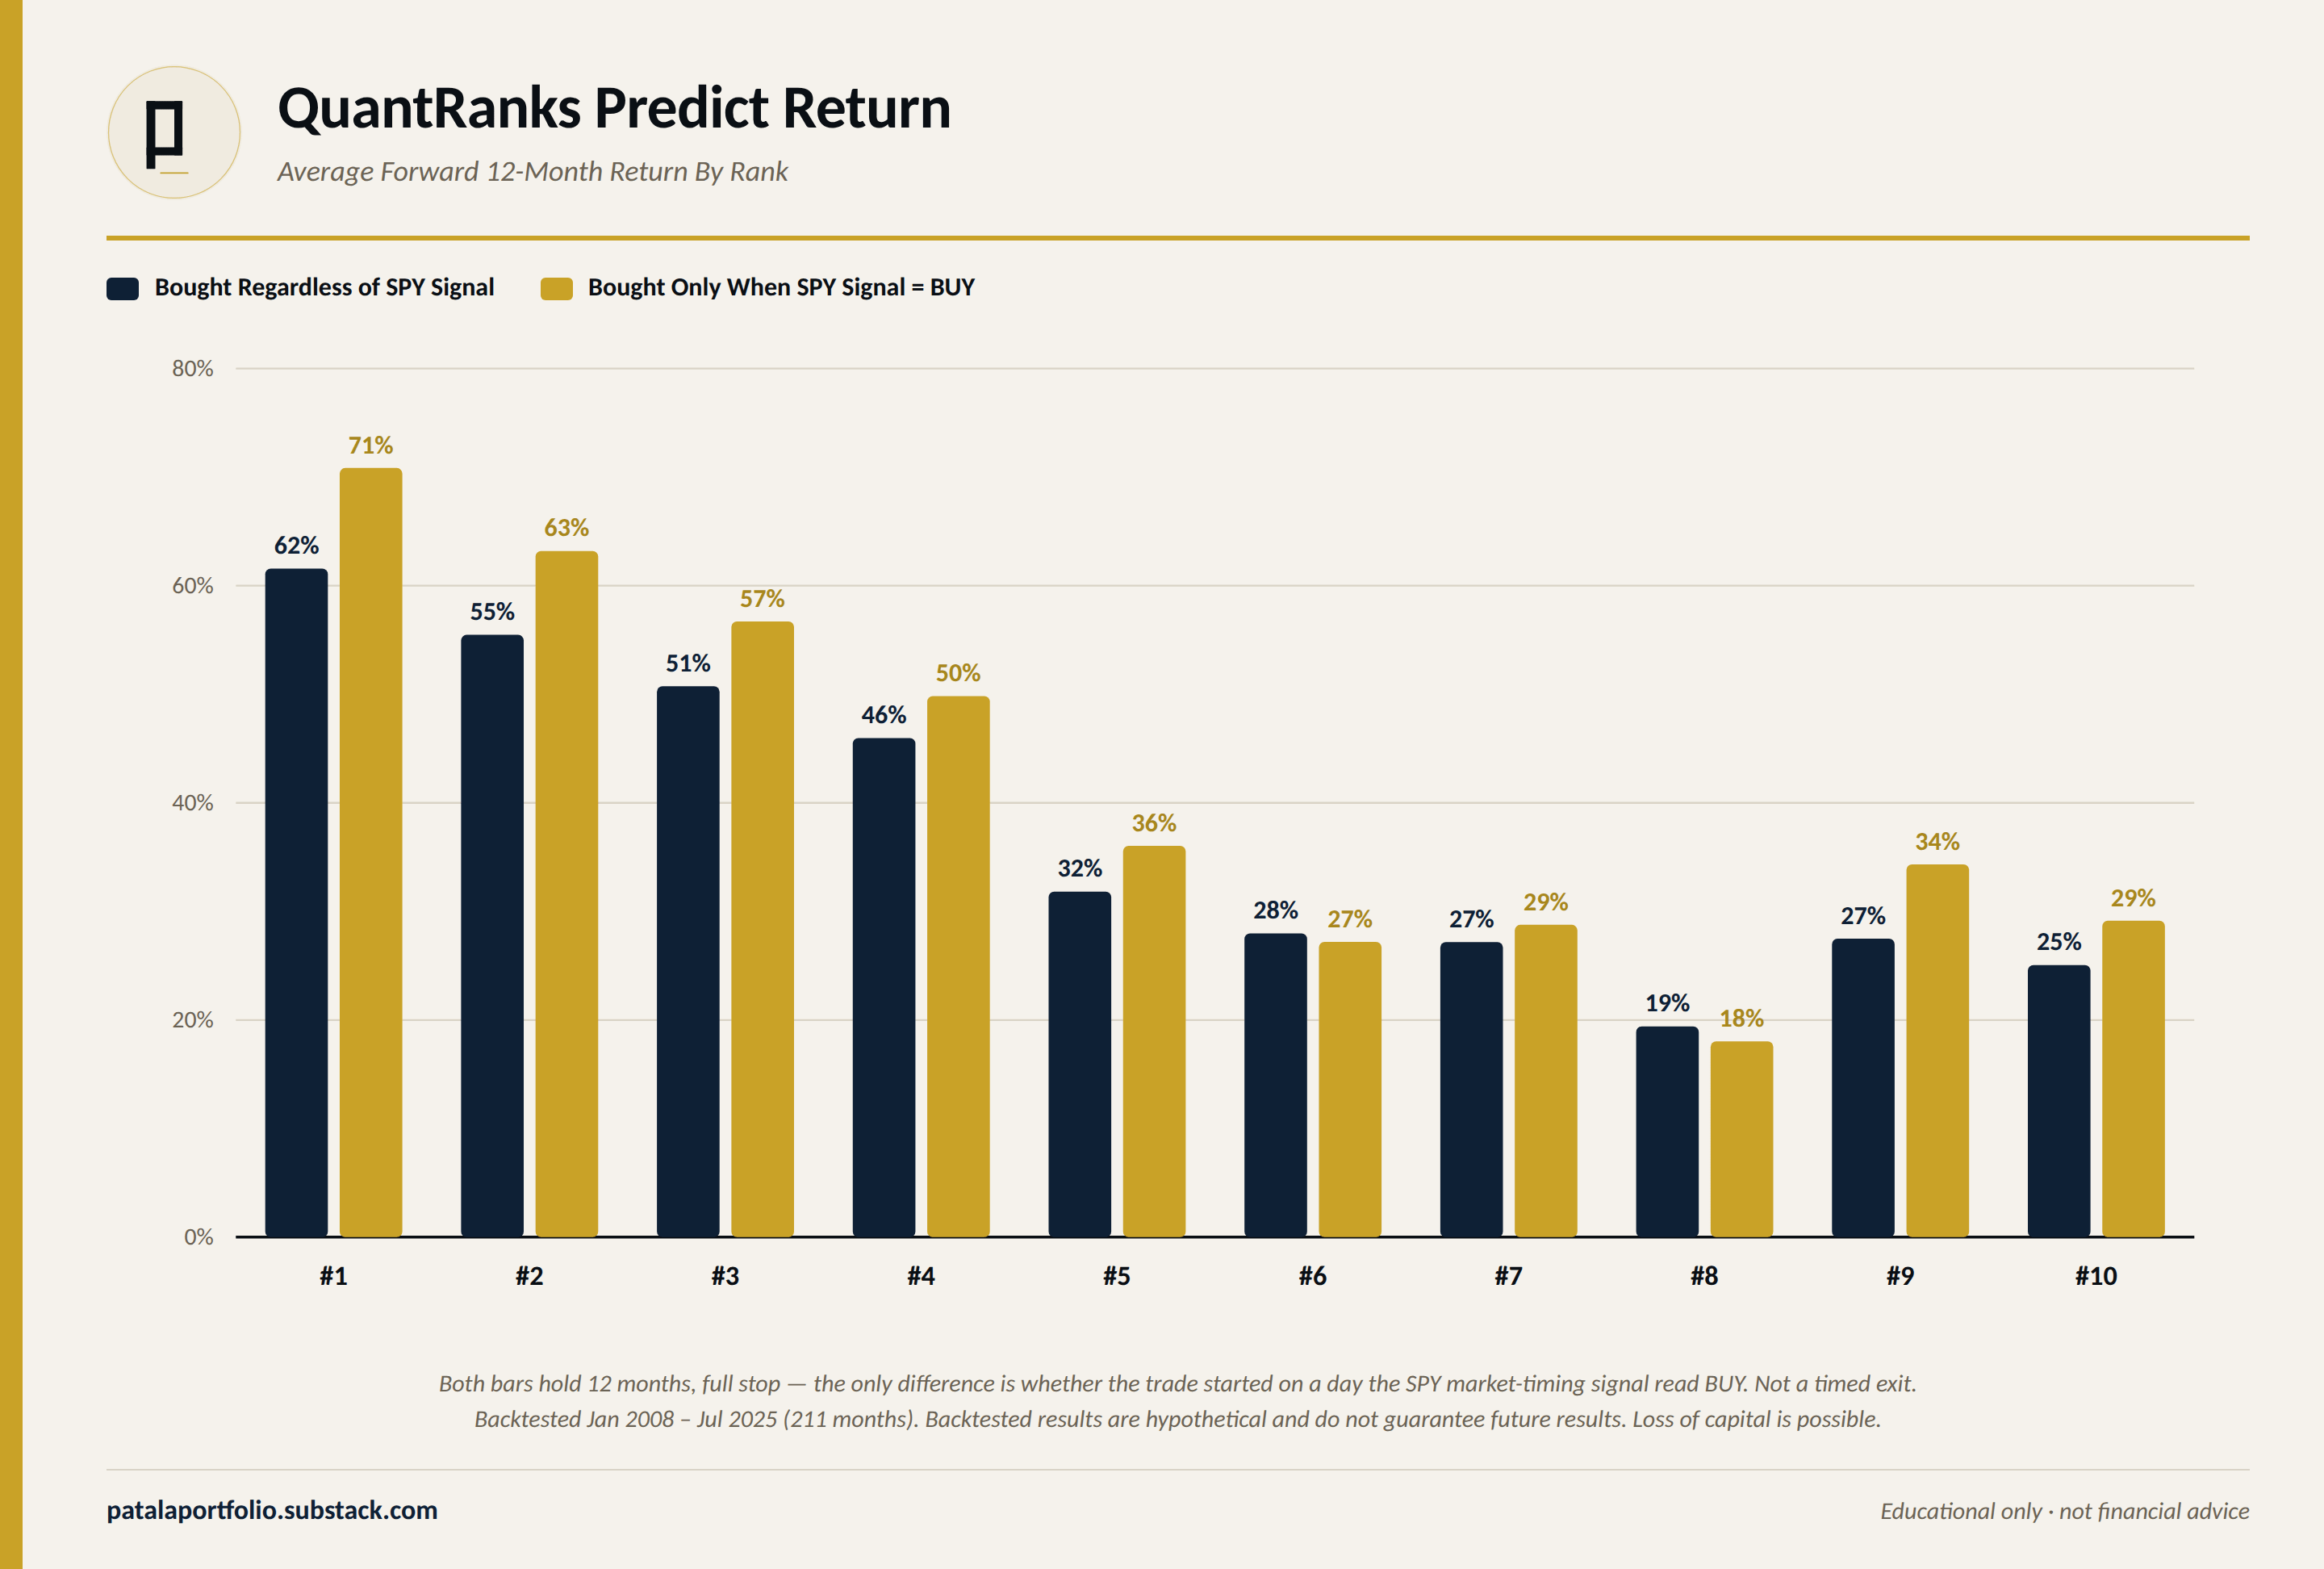
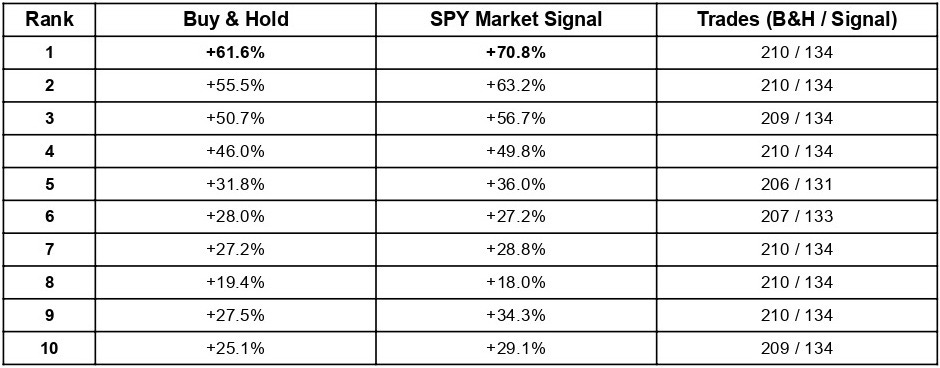
Two things stand out. First, ranks 1 through 4 form a clear tier of their own — 62% down to 46% average return, well clear of everything below them. Second, rank 5 is a visible step down, not a gradual slope — the model’s conviction really does concentrate at the top.
The same tier shows up at every holding period, not just 12 months. Here’s Buy & Hold average return by rank, all four horizons:
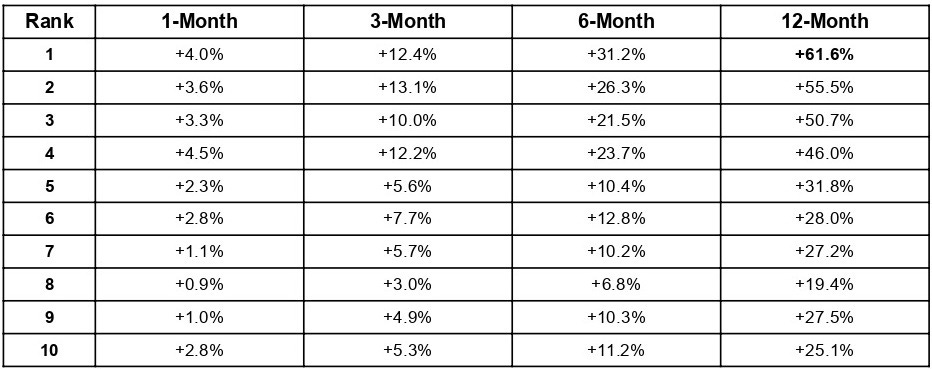
The gap between ranks 1–4 and rank 5-and-below is visible at 3 months, widens by 6 months, and is largest at 12 months. The reason this article leans on the 12-month column specifically: it’s the cleanest read on whether a rank’s edge has real staying power, rather than a short-term blip, and it’s the horizon closest to how a pick is actually held in practice — until the market-timing signal says sell, which averages considerably longer than a month. The shorter columns are here to show the pattern isn’t an artifact of picking one convenient time frame; it holds up at every horizon tested.
Here’s the same comparison for Rank 1 specifically, both entry conditions, across all four horizons:
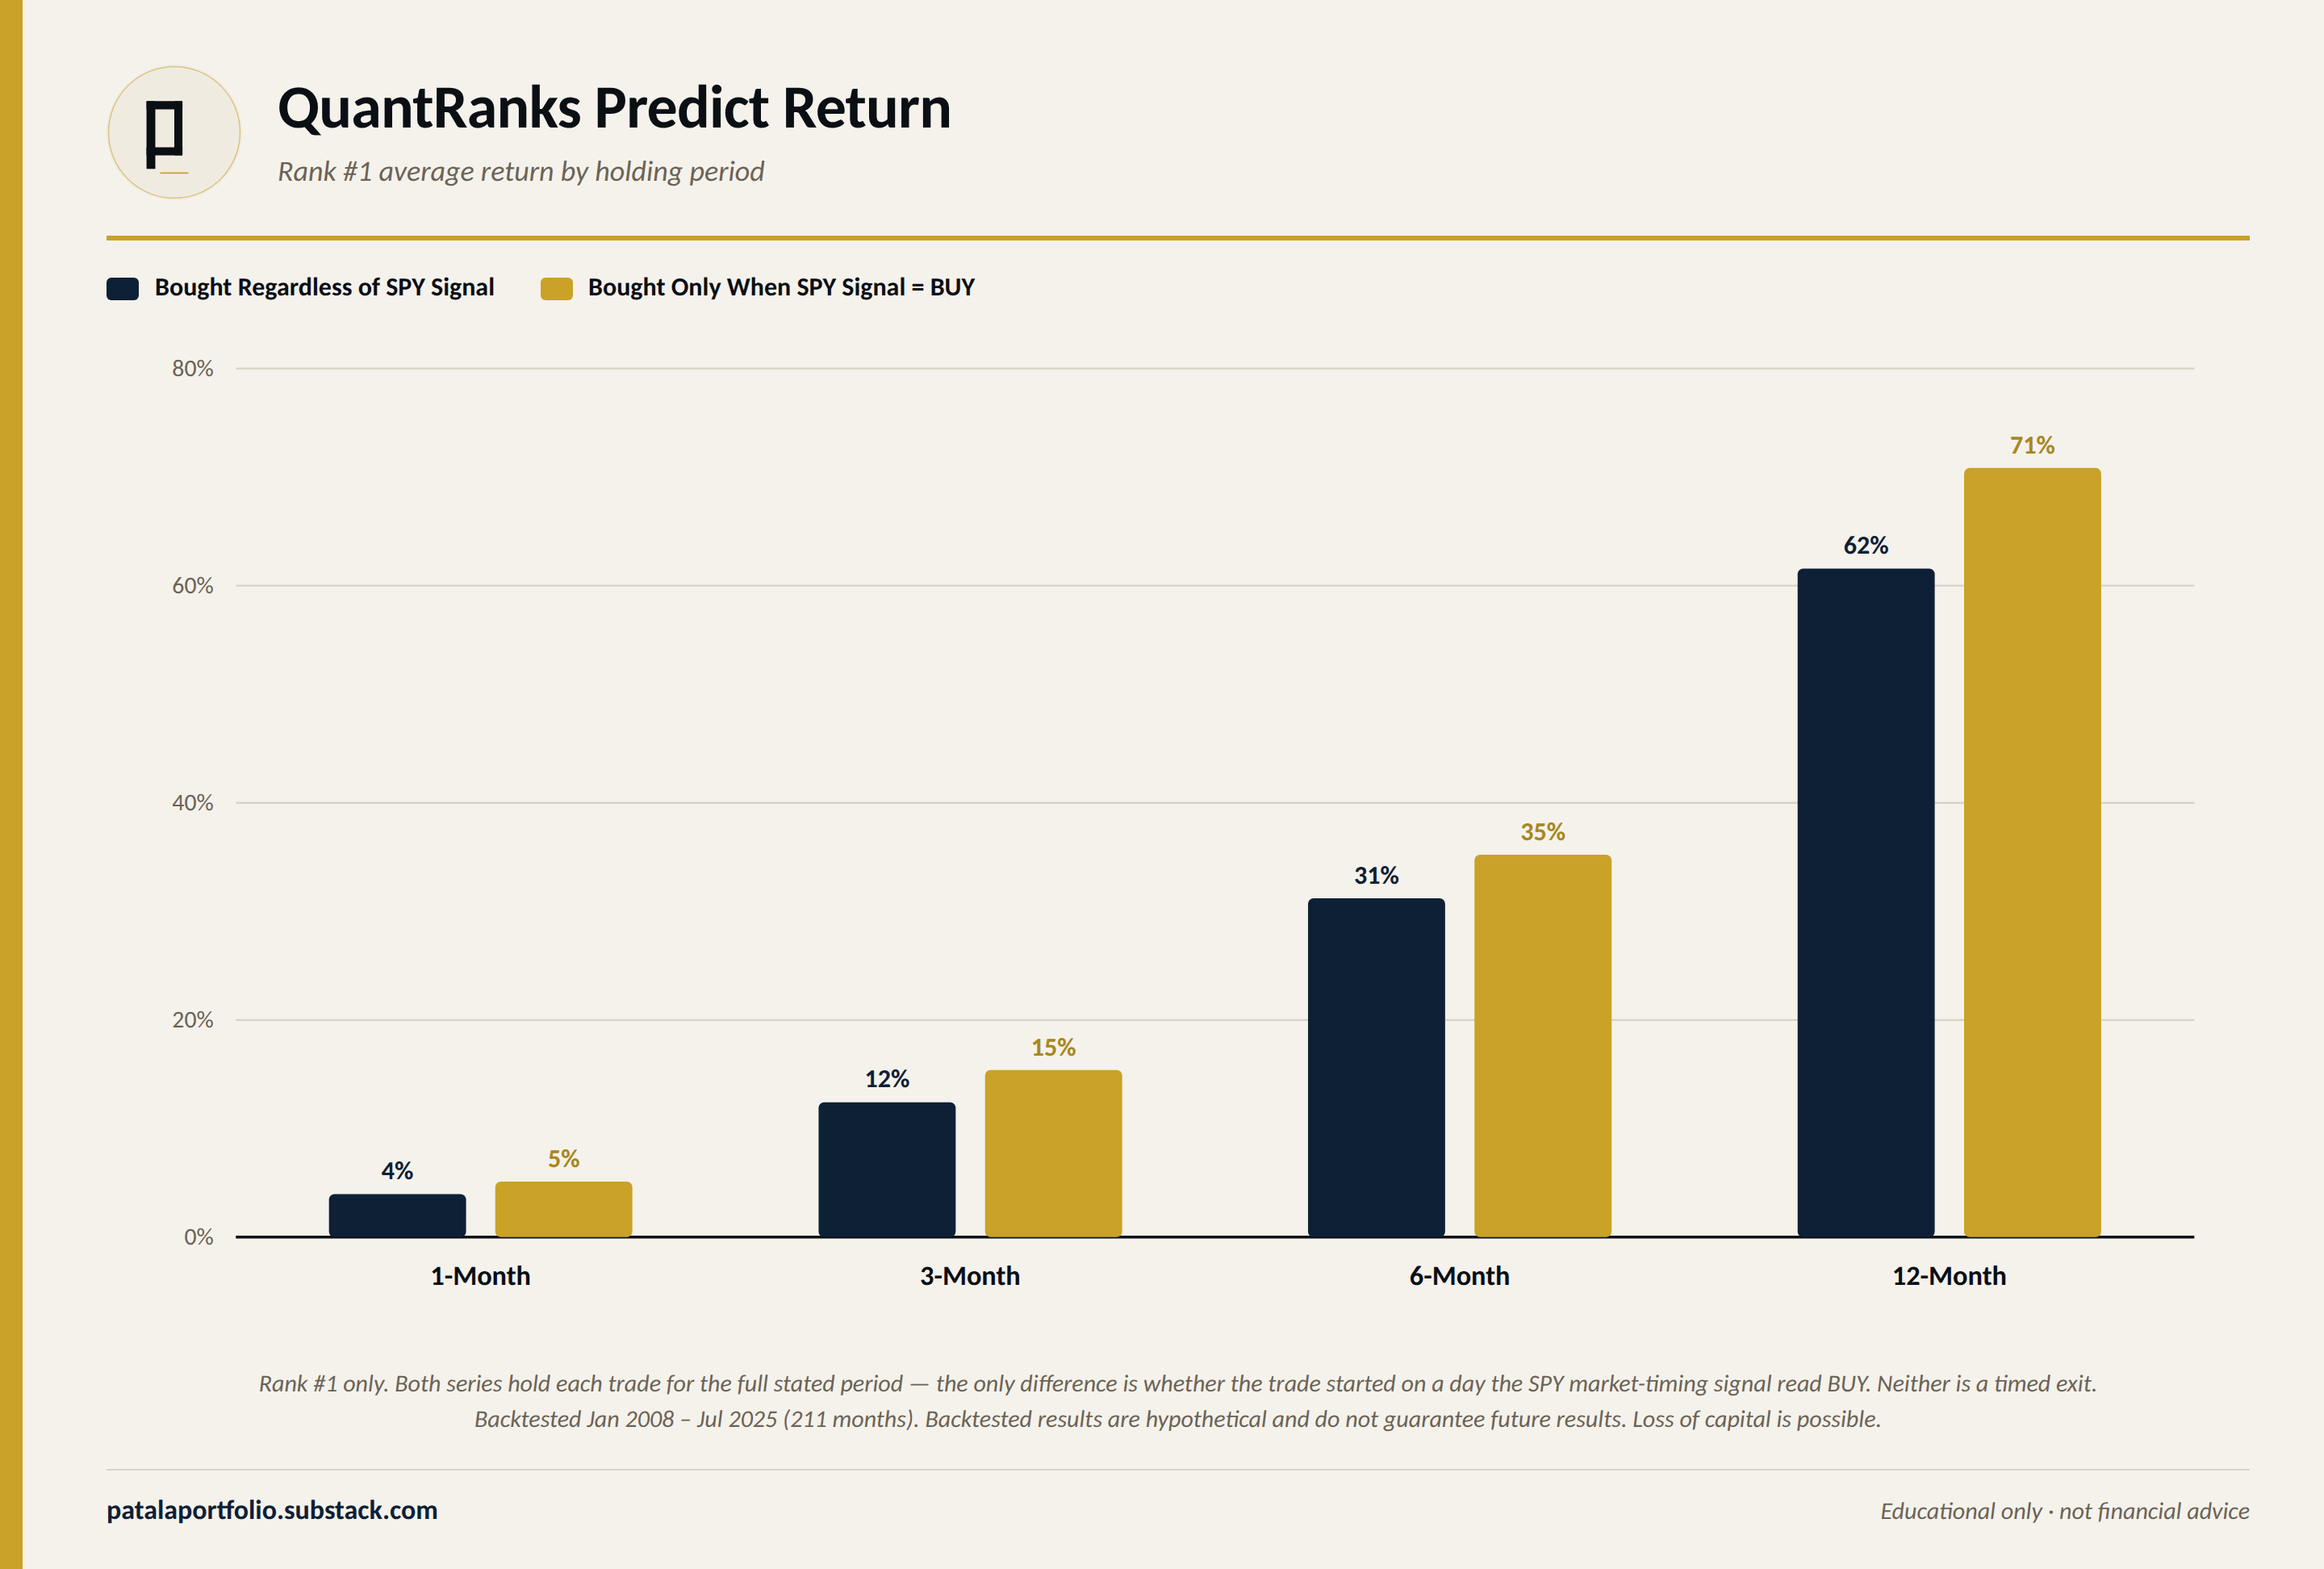
The gap between the two bars — Bought Regardless of SPY Signal vs. Bought Only When SPY Signal = BUY — widens as the holding period stretches out. At 1 month it’s barely a point. At 12 months it’s roughly 9 points. Both bars in every pair hold for the same fixed period; the only thing that differs is whether the trade started in a market the timing signal already liked.
Ranks 6 through 10 are noisier — 9 outranks 8, for instance. At this granularity, with roughly 130–210 trades per rank, that kind of local noise is expected. It’s not a sign the model reverses itself; it’s a sign that rank-by-rank precision past the top few names should be read loosely.
Why the weekly pick isn’t always Rank #1
One practical nuance worth explaining here, since it directly shapes what shows up in your inbox each week.
A stock’s QuantRank doesn’t change wildly week to week. The model re-ranks monthly, and conviction tends to concentrate on the same handful of names for weeks or even months at a stretch — that’s the “repeat name at #1” pattern regular readers have already seen.
That’s good news for the ranking’s stability. It’s a problem for a newsletter that mechanically buys “whatever is Rank #1 this week.” If the same stock holds the top spot for eight weeks running, “buy Rank #1 every week” really means “buy the same one or two stocks, over and over.” That’s not a diversified top-tier portfolio — it’s a two-stock bet wearing a diversified newsletter’s clothing.
The fix: each week, the pick moves sequentially through that month’s top tier. Week 1 of the month is Rank 1, week 2 is Rank 2, week 3 is Rank 3, week 4 is Rank 4 — and in months with a fifth Monday, week 5 is Rank 5. The cycle resets at the start of the next month.
This isn’t a compromise on quality. Look back at the rank table above: ranks 1 through 4 are a tier of their own — 62% down to 46% average 12-month return, clearly separated from rank 5 and below. Rotating through them means every single pick still comes from that top tier. What changes is that a subscriber following the newsletter for a full month ends up holding four or five distinct names instead of one stock bought four or five times over — real diversification within the tier the backtest actually supports, instead of concentration by accident.
Every rank, grouped into deciles
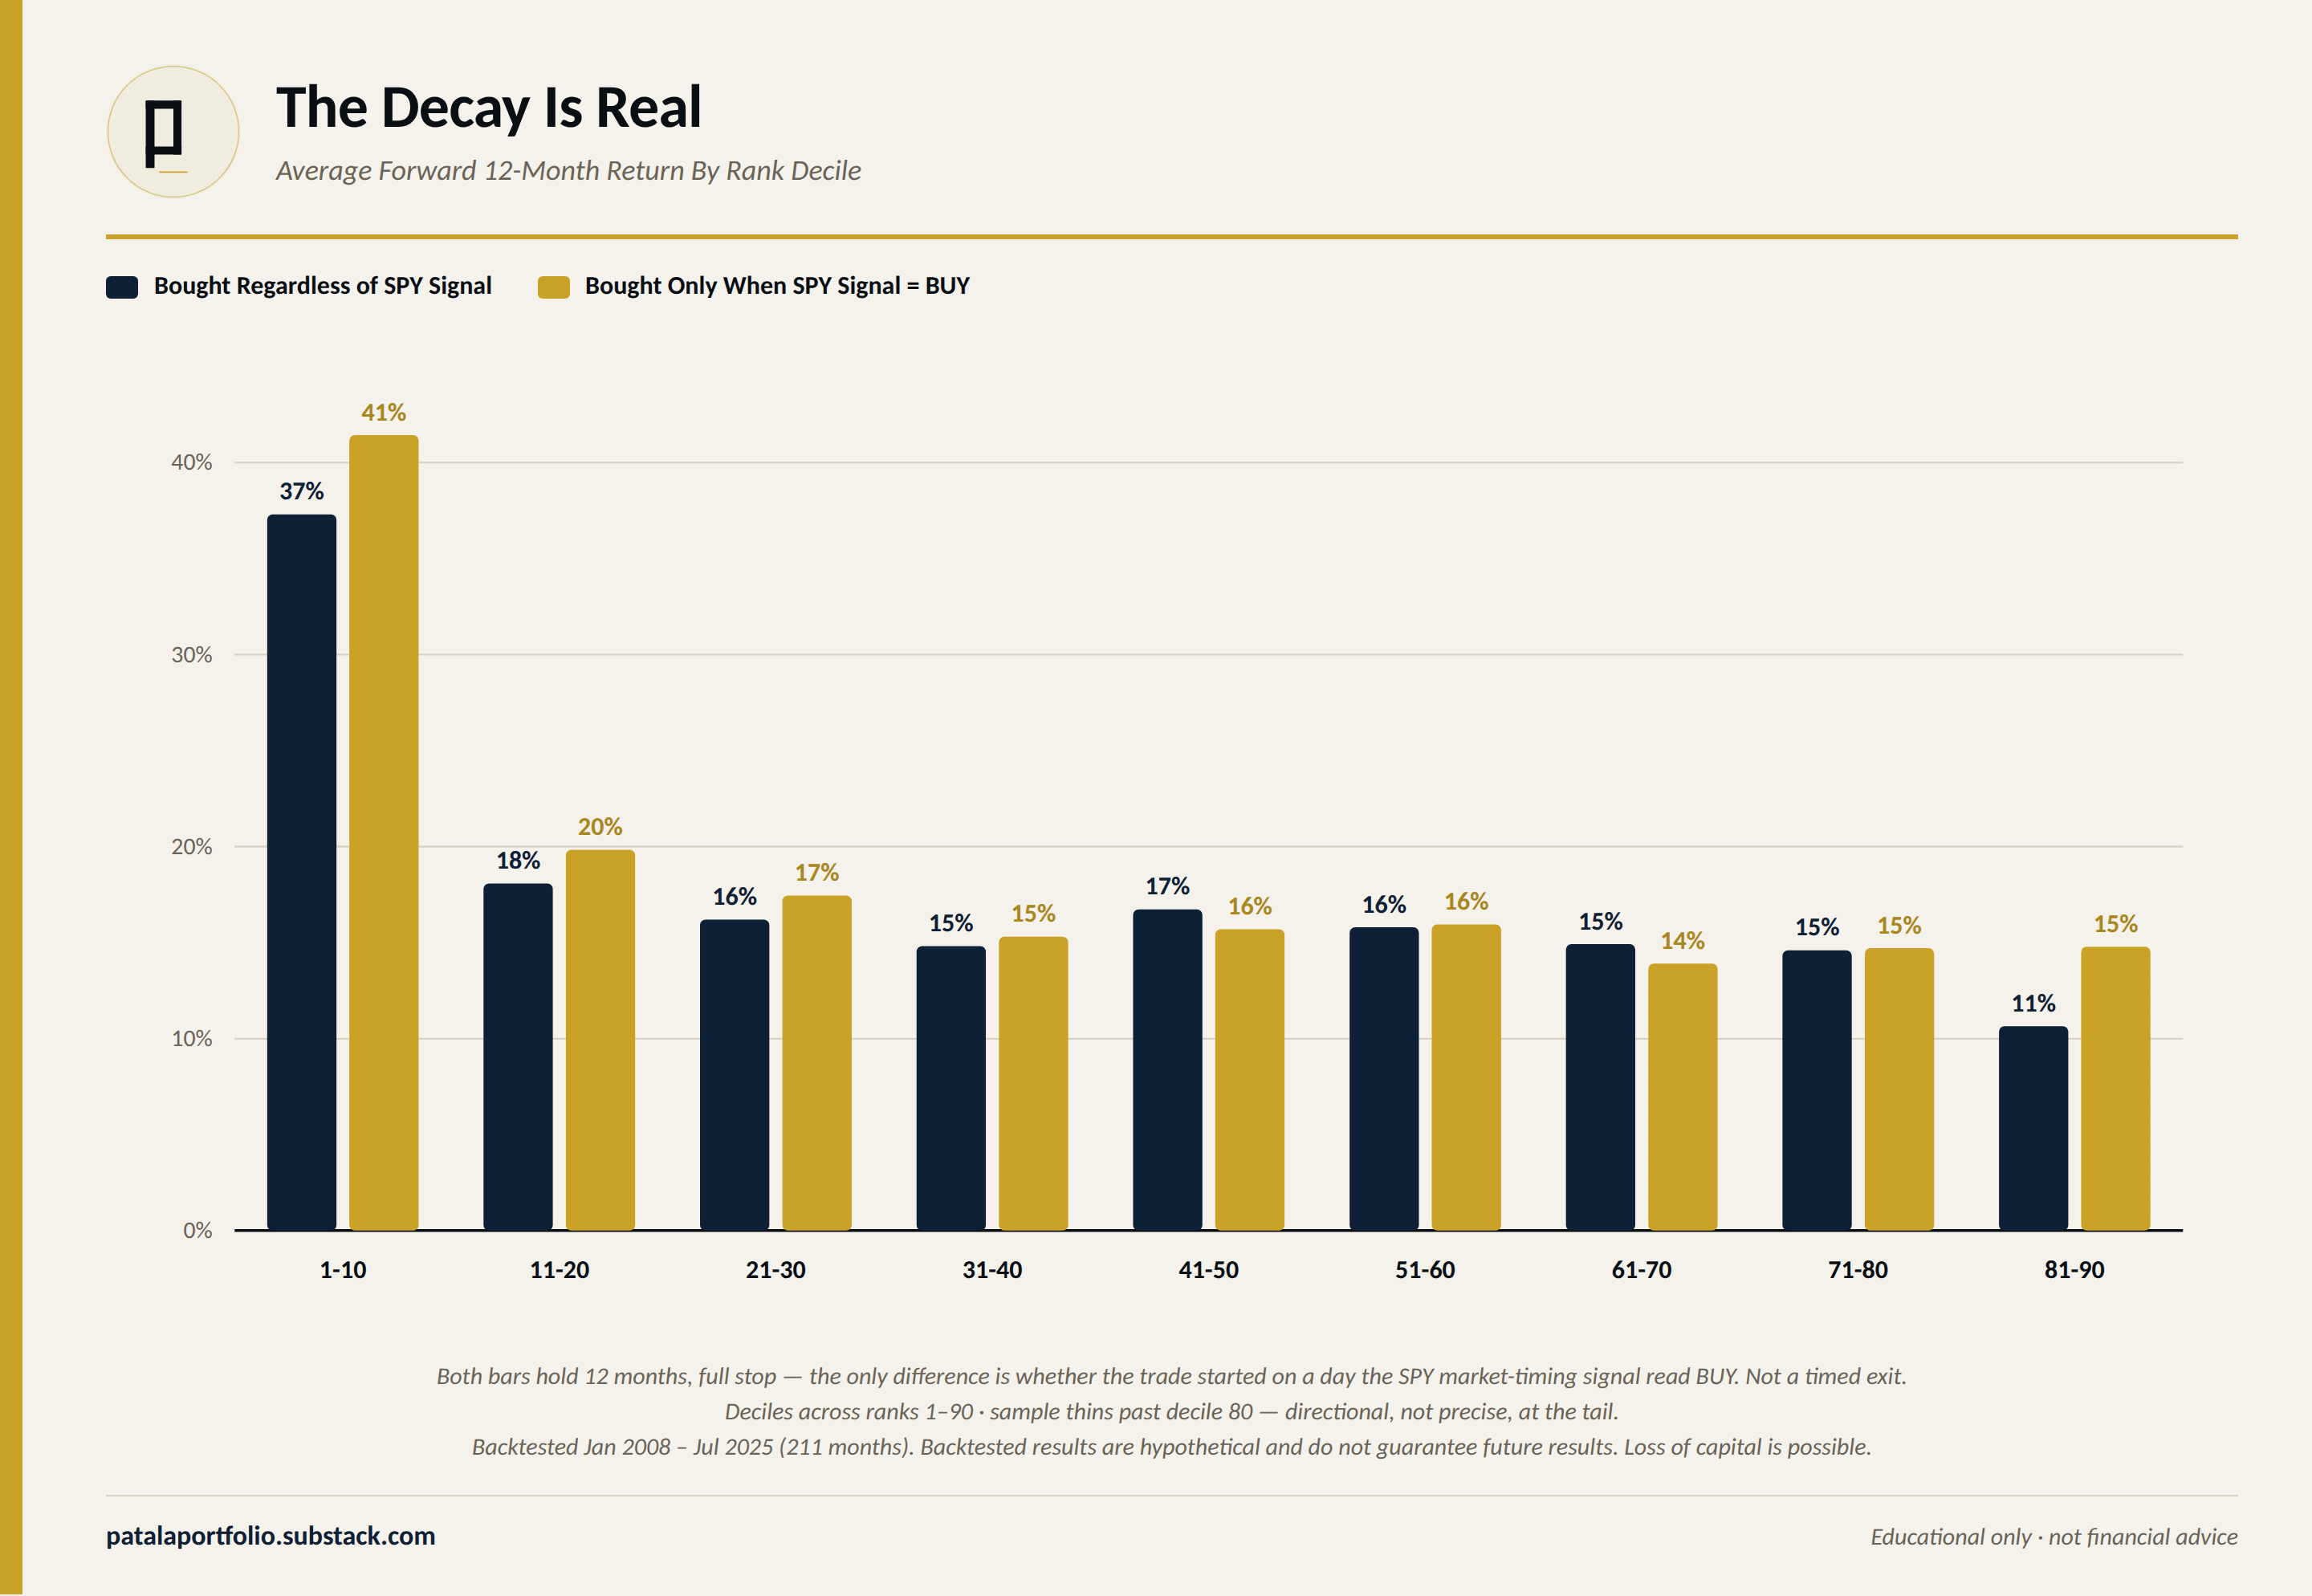
Zooming out to the full range — all ~90 ranks the model produces, grouped into tens — the pattern holds up at scale, not just at the top:
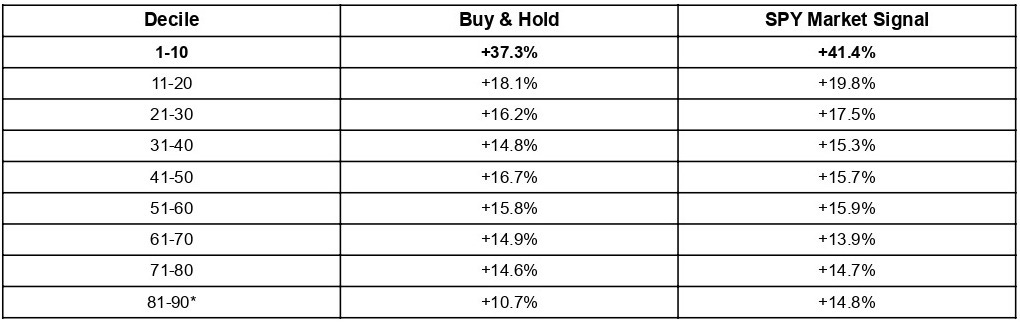
*Small sample past decile 80 — treat directionally.
This is the shape that matters most: a cliff from decile 1–10 to everything after, then a long, flat plateau. The top decile roughly doubles the return of every decile below it, and deciles 11 through 80 all sit in a fairly tight band around 14–20%. The model isn’t gently sorting 450 stocks into a smooth gradient — it’s identifying a top tier that behaves differently, and beyond that tier, further precision adds little.
That’s also, practically, the case for keeping the weekly pick inside ranks 1 through 5 rather than reaching further down the list: the real signal is concentrated at the very top.
What the Buy & Hold vs. Signal gap tells you
Look at the two columns side by side, at both the rank and decile level: SPY Market Signal is consistently a little higher than Buy & Hold, across almost every tier. For Rank 1, that gap is about 9 points (61.6% vs. 70.8%). At the decile level, decile 1–10 shows the same pattern (37.3% vs. 41.4%).
Read that carefully — it isn’t the market-timing overlay adding return through good trading. It’s a selection effect: trades that entered when the broader market signal was already healthy tended to do better, on the same fixed 12-month clock, than trades entered into an already-weak market. Buy & Hold includes both; SPY Market Signal filters toward the healthier entries. The gap is a rough measure of what market regime costs or buys you, on top of picking the same stock.
The honest limits of this backtest
This is 2008–2025, one 17.6-year window. It contains one historic crash near the start and an unusually strong run for U.S. large-cap and growth names afterward. A different 17.6 years — a longer stretch of flat or sideways markets, for instance — would very plausibly produce a smaller gap between top and bottom ranks, or a lower absolute return across the board.
Averages hide dispersion. A rank averaging 60% doesn’t mean every trade in that rank returned close to 60%. Some trades in every rank, including rank 1, lost money. The average is real, but it isn’t a promise about any single position — including next week’s.
This is frictionless. No commissions, no bid-ask spread, no slippage, no taxes, and no allowance for a stock being un-buyable at the exact price used in the backtest. Real execution will lag these numbers by some amount.
Sample size thins at the edges. Ranks and deciles built on 200+ trades (roughly ranks 1–70) are on reasonably solid footing. Past decile 80, you’re looking at a few dozen observations or fewer — real, but noisier than the headline numbers suggest.
Past performance does not guarantee future results. This is true of every number in this article, without exception. A backtest describes a period that already happened, built with full knowledge of how it turned out. It is evidence, not a promise. The live portfolio — reported monthly, with real trades and real prices — exists precisely because a backtest alone isn’t proof.
Why this matters for the weekly pick
Every Sunday’s QuantRank comes from ranks 1 through 5 — the tier that, in this backtest, decisively outperformed everything below it, with a clear gap rather than a gentle slope. Rotating through that tier week by week, instead of parking on Rank 1 alone, is how the newsletter stays both evidence-based and genuinely diversified. That’s the evidence behind the newsletter. It doesn’t mean every pick works out; some won’t. It means the selection process, tested honestly across nearly 95,000 stock-months, has done real work historically — not just on a handful of lucky names, but across the full distribution.
Disclaimer: Educational and informational only. Not personalized investment advice, and not a recommendation to buy or sell any security. I am not a registered investment adviser, broker-dealer, or financial planner. All performance figures in this article are backtested and hypothetical — derived from the retrospective application of a model to historical data. They do not represent actual trading and do not reflect trading costs, commissions, slippage, or taxes. Hypothetical results have inherent limitations, including the benefit of hindsight, and results may vary with each use and over time. Past performance — whether backtested or live — does not guarantee or indicate future results, and future results may be materially worse. Investing in equities involves substantial risk, including the possible loss of some or all of your capital. Concentrated positions in individual stocks carry materially greater risk than a diversified index fund. You should not rely on this publication as the basis for any investment decision. Consult a qualified, licensed financial adviser who understands your full circumstances before investing.