
Across the first three posts in this series, the same one-signal system compounded a $10,000 stake into numbers that get harder to believe each week. On the S&P 500 it turned $10,000 into $1.75 million, with a worst drawdown of −8.5% versus −50.8% for buy and hold. On the Nasdaq-100 via QQQ it turned $10,000 into $9.2 million and sidestepped an 81% dot-com crash, ending with a worst drawdown of −9.97%.
At the end of the QQQ post I promised this one — the same signal on TQQQ, ProShares’ 3x-leveraged Nasdaq-100 fund — “with its own serious risk warnings.” This is that post. The numbers are the largest I’ve ever produced, and so are the caveats. I’m going to give you both, in that order of importance: the caveats first, then the numbers.
Elevate ANY investment strategy with Quantitative Market Signals & High-Potential stocks. Sidestep major market crashes. 26+ year backtested QQQ performance: 29% CAGR with just 10% drawdown.
Read this before the charts
TQQQ is not QQQ. It is built to deliver three times the daily move of the Nasdaq-100. That leverage is a double-edged sword, and you need three facts in front of you before a single dollar figure:
This backtest starts in March 2010 — the month TQQQ launched — which means it never lived through the 2000 dot-com crash or the 2008 financial crisis. Buy-and-hold QQQ fell 81% in dot-com; a 3x version would have been all but wiped out. Both columns you’re about to see are flattered by a start date sitting near the bottom of a historic bull market.
Leverage decays. Because TQQQ resets 3x every day, choppy, sideways markets bleed value out of it even when the index goes nowhere. Holding it blindly is how people get hurt.
The billion-dollar figure is a hypothetical backtest. Nobody actually turned $10,000 into $1.5 billion. Taxes, spreads, slippage, and the fund’s own costs would take large bites out of any real-world version. I’ll come back to this.
With all of that on the table: the reason this post exists isn’t the size of the ending number. It’s how the number was produced — by refusing to be invested during the exact declines that destroy a leveraged fund. That behavior is the whole story. The dollar figure is just what it looks like when you compound it on 3x leverage for sixteen years.
$10,000, two paths, 16+ years
Here is the same $10,000 invested in TQQQ from March 2010 to July 2026. One line simply buys and holds the 3x fund. The other follows my timing signal — in TQQQ when it says BUY, in cash (Treasury bills) when it says SELL.
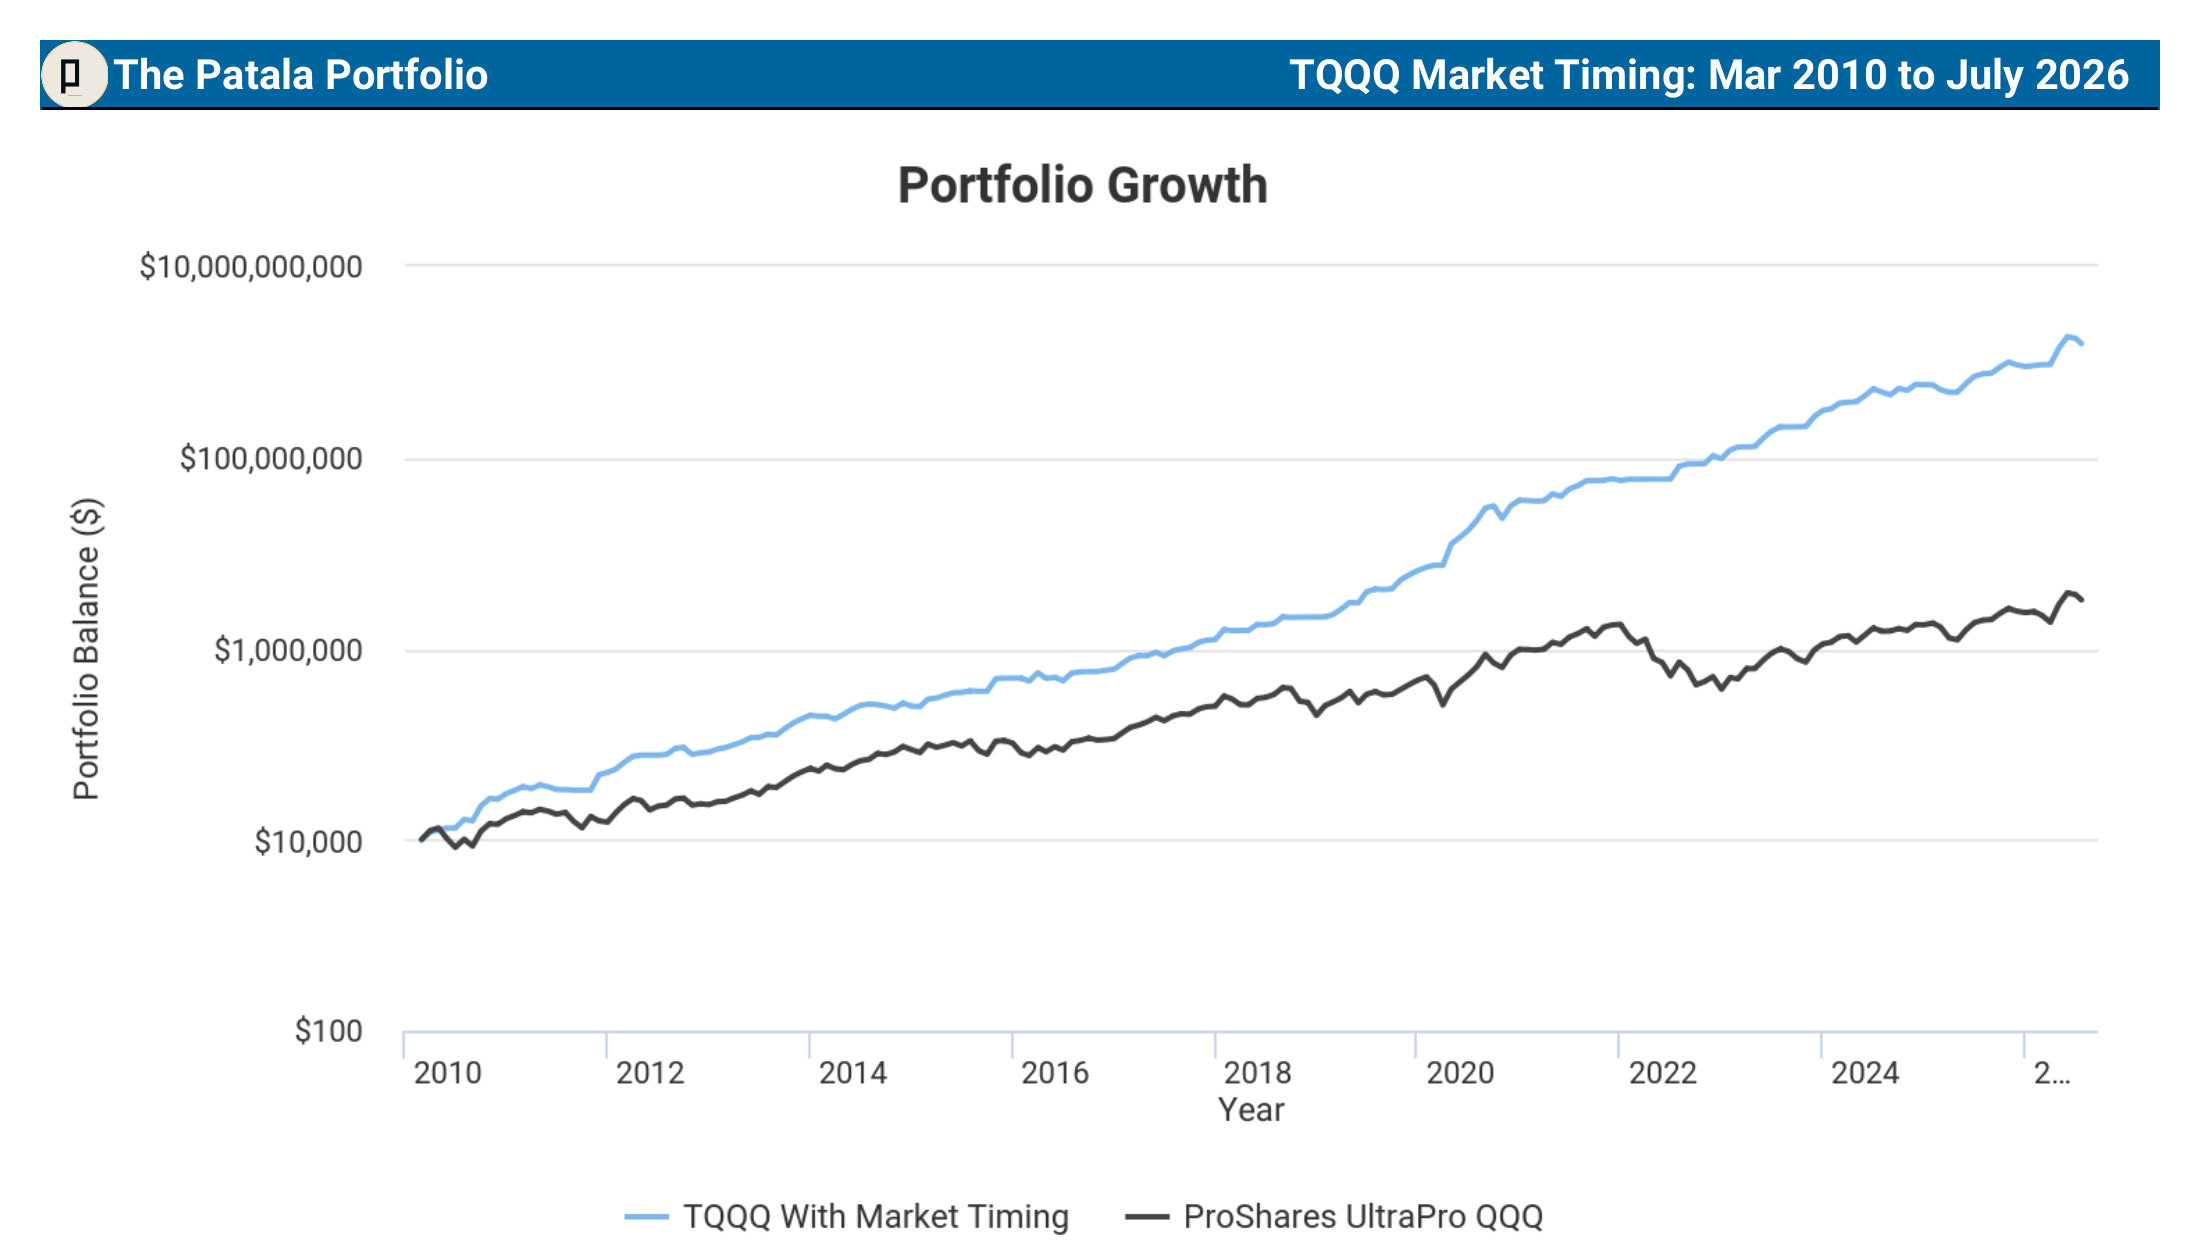
The timing signal turned $10,000 into $1,556,036,008. Buy and hold turned the same $10,000 into $3,231,561.
Both are enormous — buy-and-hold TQQQ from the bottom of 2010 was itself a rocket. But the signal produced roughly 480 times the ending wealth of holding the exact same fund. The CAGR gap tells the story cleanly: 107.14% a year with the signal, versus 42.19% for buy and hold. On a 3x instrument, a 65-point annual gap doesn’t add up over sixteen years — it explodes.
Why does timing matter even more here than it did on SPY and QQQ? Because of what leverage does on the way down.
The 79% crash — and why leverage makes it lethal
On an unleveraged index, a crash is a setback. On a 3x fund, a crash is closer to an extinction event, because the math of recovery turns brutal.
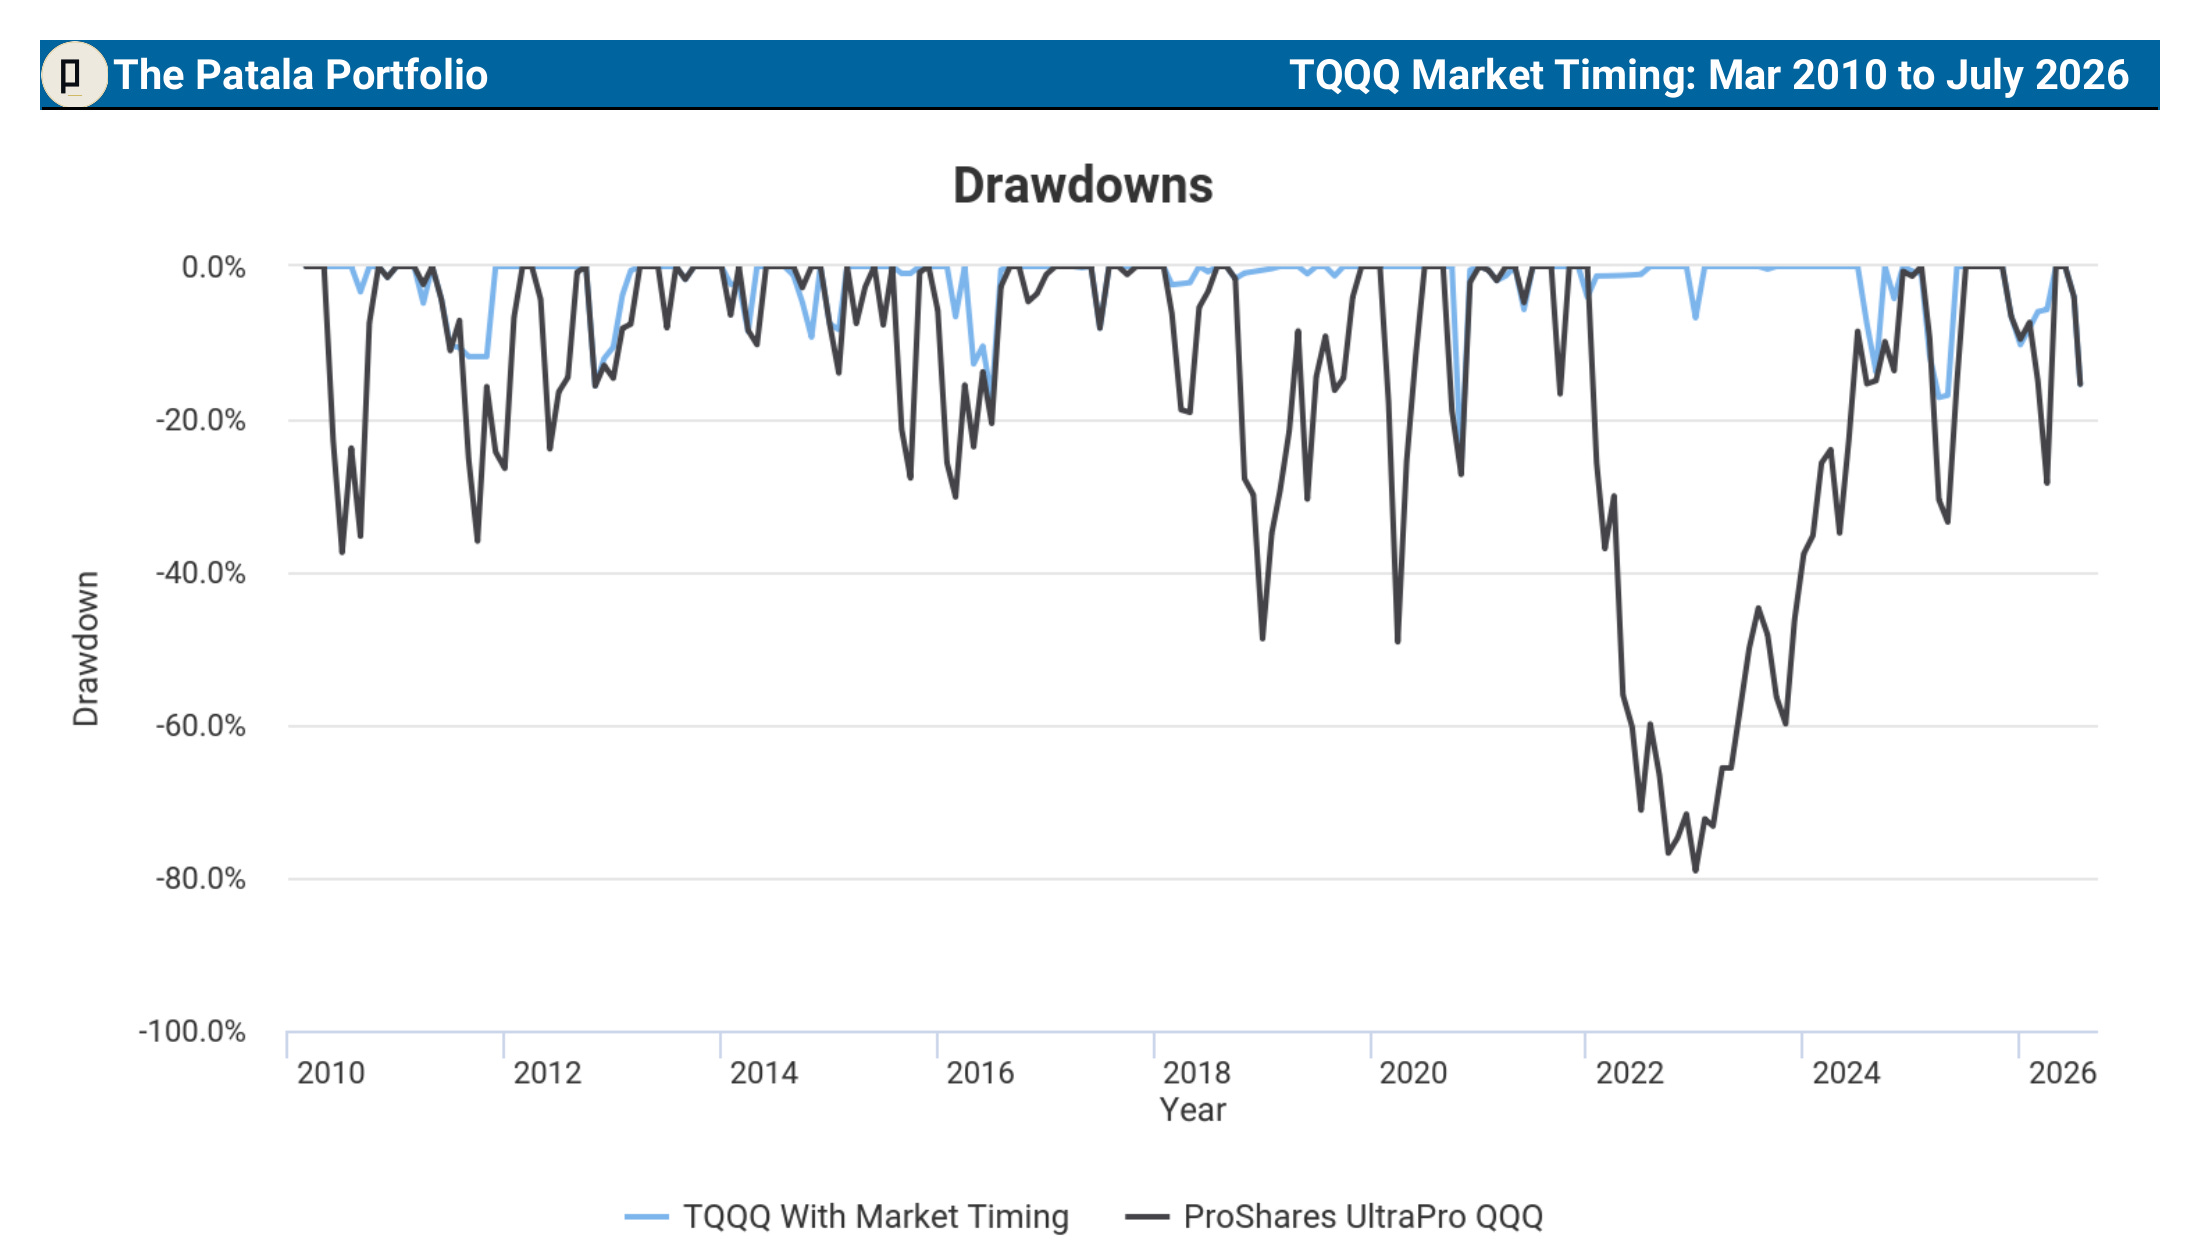
A buy-and-hold TQQQ investor watched the fund fall 79.08% in 2022. To climb back from a 79% loss, you don’t need a 79% gain — you need a gain of roughly 378% just to return to even. It took about two years to recover, and the position spent more than three years underwater. And 2022 wasn’t the only one: buy-and-hold TQQQ also fell about 49% in the COVID crash and about 49% in late 2018.
The timing signal’s worst drawdown over the same 16+ years was −26.03% — a single ugly month in October 2020 that it recovered from in two.
Look at the stress numbers from the report:
COVID-19 crash (Jan–Mar 2020): signal 0.00% vs buy & hold −49.12%. The signal was already in cash when the market fell.
2022 bear market: signal max drawdown −26.03% vs buy & hold −79.08%.
This is the point about leverage decay made concrete. A 3x fund that avoids the worst months doesn’t just skip the pain — it skips the compounding damage that a 79% hole inflicts on everything that comes after it.
The signal didn’t beat buy and hold by picking better stocks. It owns the exact same fund. It simply wasn’t there for the drawdowns that leverage turns into craters.
Every risk measure, side by side — 16+ years
Here’s the full dashboard rather than a cherry-picked stat. Straight from the Portfolio Visualizer report:
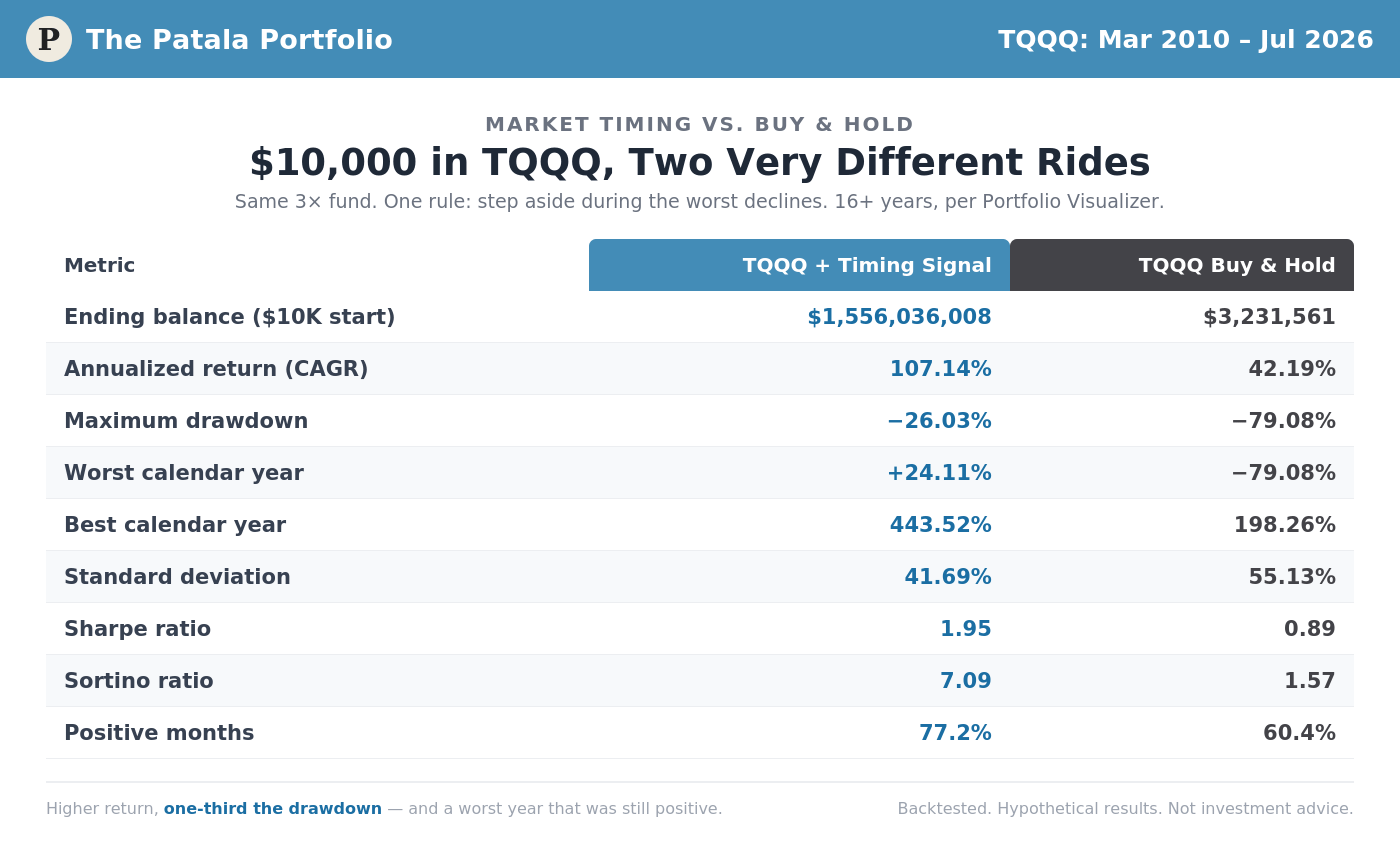
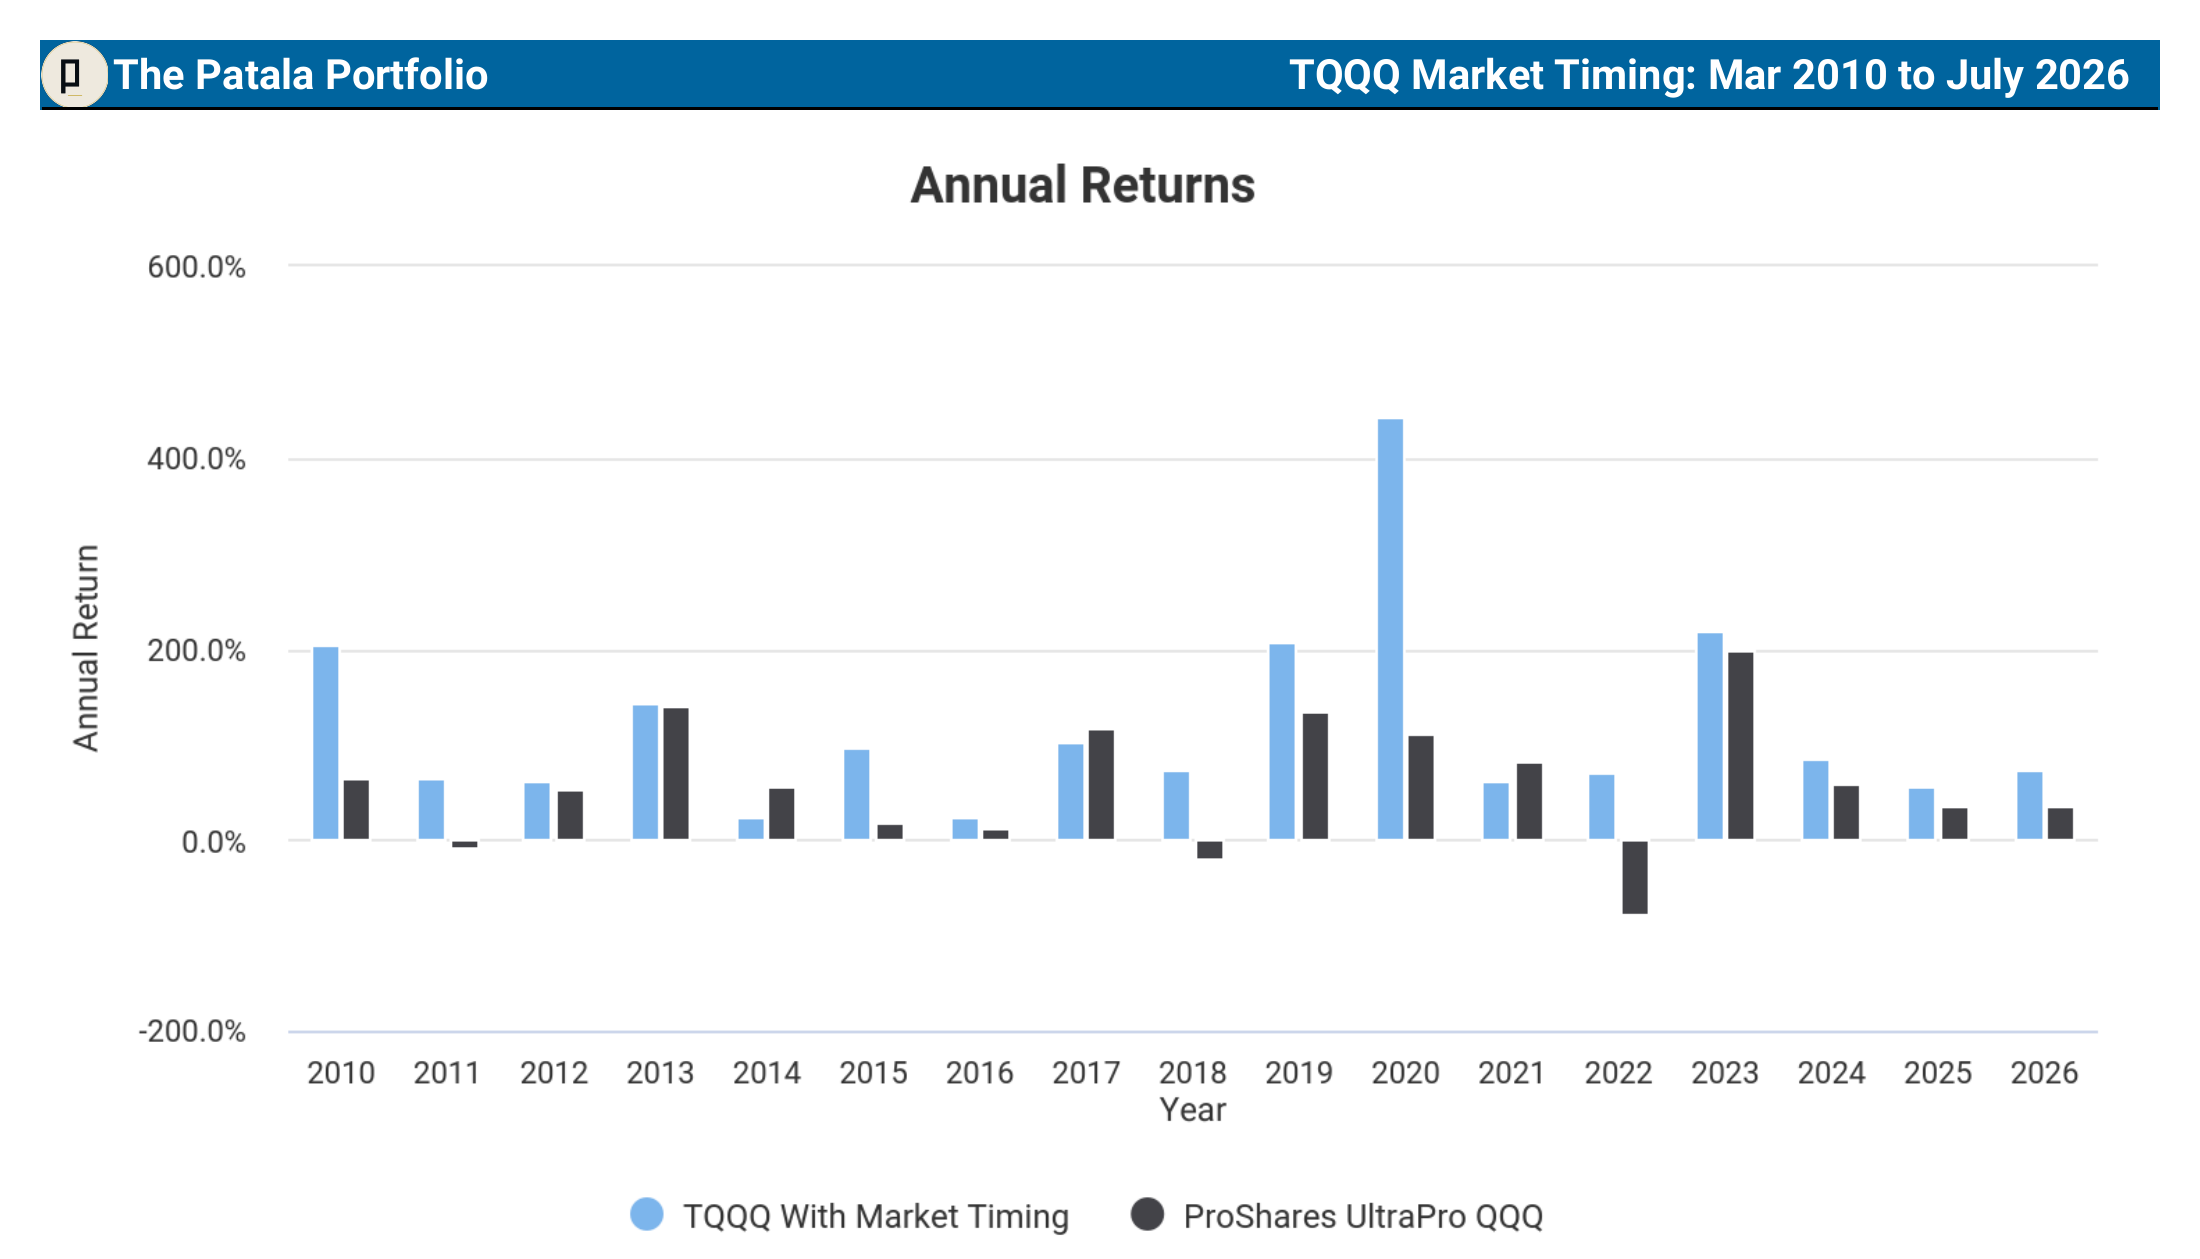
Read the worst-year line again. Over sixteen-plus years — through the 2018 selloff, the COVID crash, the 2022 bear market, and every wobble in between — the signal’s worst calendar year on a 3x leveraged fund was positive, up 24.11%. Buy and hold had a −79.08% year.
The risk-adjusted numbers say the same thing from another angle. A Sharpe of 1.95 versus 0.89. A Sortino of 7.09 versus 1.57. A downside-capture ratio of 19.6 — meaning the signal absorbed less than a fifth of the fund’s down moves — versus 100 for buy and hold. Higher return, lower volatility, a fraction of the drawdown. That combination isn’t supposed to exist, and on an unleveraged fund it barely does. Leverage is what widens the gap this far: the same discipline that helped on SPY and QQQ is worth multiples more when every avoided decline is a 3x decline.
Why leverage changes the whole equation
It’s worth being explicit about the mechanism, because it’s the reason a 3x fund is the most dramatic showcase for this system and the most dangerous thing to hold without it.
A leveraged ETF resets its exposure daily. In a steady uptrend, that daily compounding works for you — which is how buy-and-hold TQQQ still reached $3.2 million. But in volatile or sideways markets, the daily reset works against you: the fund can lose money even when the index finishes flat. That’s volatility decay, and it’s why every deep drawdown on a 3x fund does double damage — first the loss itself, then the drag on everything that follows.
The signal’s entire job is to cut off that left tail. It stays invested to capture the leveraged upside and steps aside — into T-bills — during the declines where leverage compounds against you. On SPY that discipline was valuable. On QQQ it was powerful. On TQQQ it’s the difference between a fund that’s essentially un-hold-able and one whose worst year was green.
The same system, a far more powerful engine
Nothing about the method changed from the SPY and QQQ posts. It’s the same two-layer signal:
A macro model that makes one BUY/SELL call on the first trading day of each month.
A daily model that divides the market into 158 zones, only 11 of which trigger a SELL — so it stays invested through ordinary volatility and steps aside only for genuine danger.
The only thing that changed is the instrument. On the S&P 500 the same discipline compounded $10K into $1.75M. On the Nasdaq-100 it compounded into $9.2M. On a 3x Nasdaq fund it compounded into far more — because there was more upside to capture on the way up, and a far deeper set of craters to avoid on the way down.
The serious risk warnings I promised
I meant it when I said the caveats matter more than the number. If you take nothing else from this post, take this section.
Backtested, hypothetical results. These figures come from applying the signal to historical data. They are not a live track record. No investor actually earned $1.5 billion, and backtests always look cleaner than reality.
The start date does a lot of work. Beginning in March 2010 excludes the dot-com crash and 2008 entirely. On a 3x fund, those events would have been close to fatal for a buy-and-hold holder. Don’t read either column as a promise about the next sixteen years.
Real-world frictions are large — and worst on leverage. Every SELL and BUY is a taxable event; in a normal account these are short-term gains taxed as ordinary income, which is a serious drag on any strategy that trades. Add bid/ask spreads, slippage on signal days, tracking error, and TQQQ’s own expense and financing costs, and the real-world outcome is materially lower than the backtest.
Leverage decay is real. Sideways and choppy markets erode a daily-reset 3x fund even when the index is flat. This cuts both ways and can make live results diverge from any model.
The signal is not magic. It still took a −26% month in 2020, and it whipsawed in and out repeatedly in years like 2022. A missed, late, or mistimed trade around a crash matters far more on 3x than on 1x.
Concentration. When invested, this is 100% in a single leveraged ETF — no diversification, by design.
Leveraged ETFs carry issuer and regulatory warnings that they are generally not intended to be held long-term. Holding TQQQ blindly is exactly the behavior this system is built to avoid.
None of this erases the edge — sidestepping the worst declines is genuinely valuable, and the risk-adjusted numbers are real features of the backtest, not accidents. But the honest framing is: this is the highest-octane version of a disciplined system, not a money printer.
Which version is right for you
Across three posts you’ve now seen the same signal on three instruments, in rising order of aggression:
SPY — steadiest ride, −8.5% worst drawdown. Good for an IRA/401(k) or anyone who wants the smoothest path.
QQQ — higher octane, −9.97% worst drawdown, far higher returns. For those who can stomach a more volatile index.
TQQQ — maximum aggression, −26% worst drawdown with the signal, −79% without it. Only for those who fully understand leverage and would never hold it unhedged.
All three beat buy and hold on every risk-adjusted measure. But “highest ending number” is not the same as “right for you.” Most investors should not put everything into a 3x fund, signal or no signal. The value of the TQQQ post isn’t a recommendation to pile in — it’s proof of how much a single discipline is worth when the downside is leveraged.
This is the same system, twenty years in the making, running on one daily signal. From here I’ll publish where it stands every week, and every flip the day it happens — wins and whipsaws both. The live record continues.
The simplest market timing signal in the world. One signal. One trade when it flips. Under five hours a year.
Disclaimer: I am not a registered investment adviser, and nothing here is personalized investment advice, a recommendation, or an offer of advisory services. This publication is for informational and educational purposes only. Leveraged ETFs such as TQQQ carry substantial risk, including volatility decay and the potential for rapid, severe losses, and are generally not designed to be held long-term. Performance figures are generated by Portfolio Visualizer from historical data and a backtested application of the signal; backtested results are hypothetical, have inherent limitations, do not reflect trading costs or taxes, and do not guarantee future results. Consult a qualified financial adviser before investing. You are solely responsible for your own decisions.
Super interesting article on the timing and etf vehicle. I’m curious ( after reading this article), how the 100% TQQQ compares to the Blended strategy with 50% in TQQQ. Thank you for allowing me to peek behind the curtain as a pledged subscriber.