

I am an engineer. Not a banker, not a finance-school graduate — an engineer who spent more than twenty years obsessed with a single question about the stock market. For the past five years I’ve been running the answer I found with my own investments, managing over $1 million. And I think my engineering background is exactly why it works.
Engineers are trained to find the signal inside the noise. Hand us a chaotic system and we will take it apart, measure it, and ask the same stubborn question for years: what actually drives this?
For me, that system was the market. And the question that wouldn’t let go was simple: is there a reliable way to know when to be invested and when to step aside?
Not stock-picking. Not predicting the future. Just that one binary decision, made well, repeatedly, for decades. Because if you get it right, you avoid the catastrophic losses that quietly destroy most people’s wealth — the 50% drawdowns that take years to climb out of.
More than twenty years of quantitative research and 26+ years of backtesting later, I had my answer — and for the past five years I’ve been investing my own money with it. I’ve come to believe it may be the simplest effective investment system in the world.
Let me show you what it did — using an independent report from Portfolio Visualizer, not my own spreadsheet.
$10,000. Two Paths. 26+ Years.
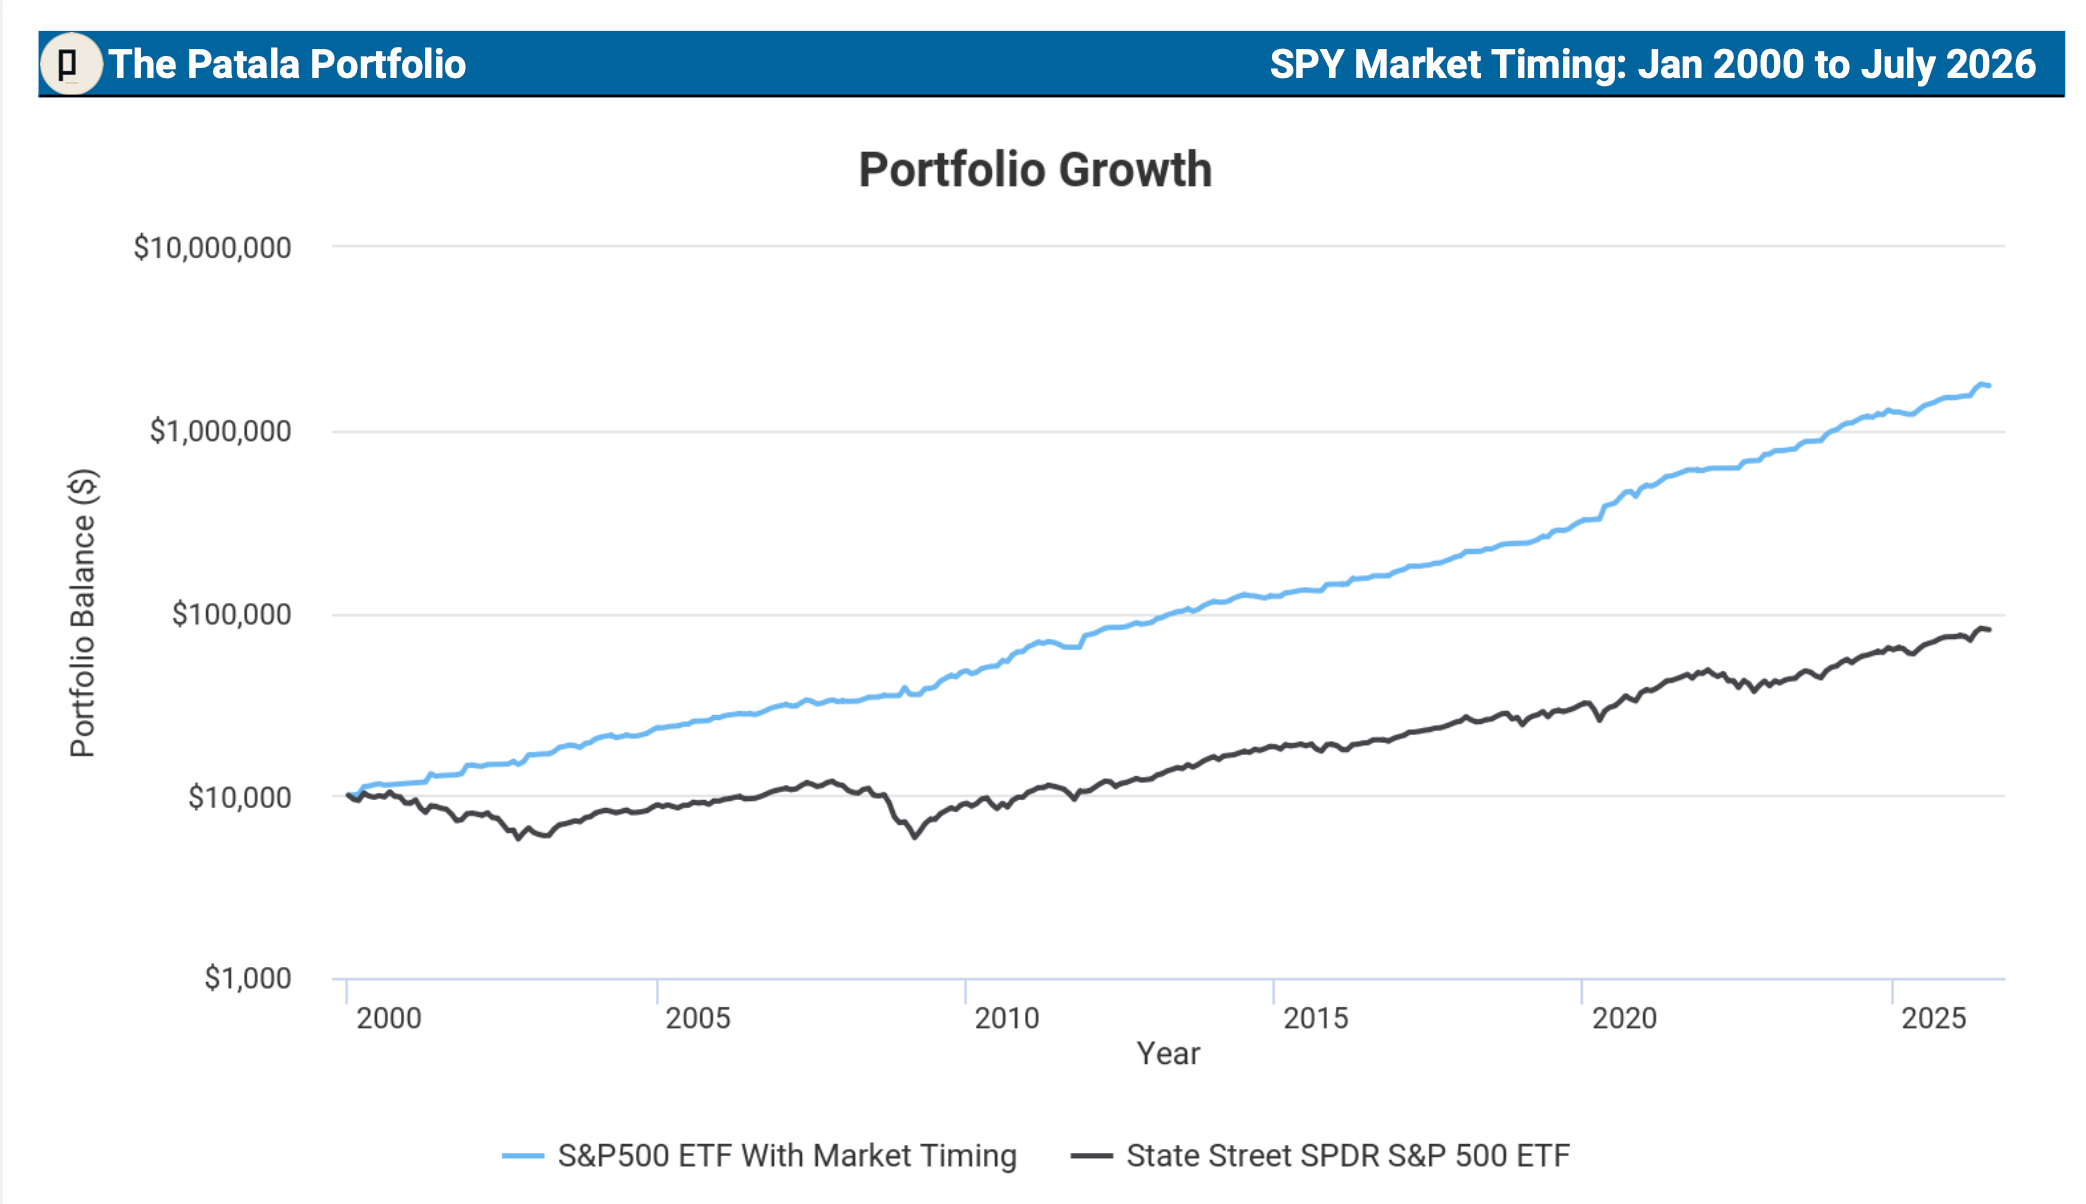
Here is the same $10,000 invested in the S&P 500 from January 2000 to July 2026 — more than a quarter century. One line simply buys and holds SPY. The other follows my market timing signal: in the market when it says BUY, in cash when it says SELL.
Same index. Same starting amount. The only difference is knowing when to step aside. Over these 26+ years the timing system turned $10,000 into $1,752,776. Buy and hold turned it into $80,825. That is more than 21 times the ending wealth — from the same index, driven entirely by one decision made consistently across more than two decades.
But the returns aren’t even the best part
Here’s what took me years to fully appreciate: the power of this system isn’t in the gains. It’s in the losses it avoids.
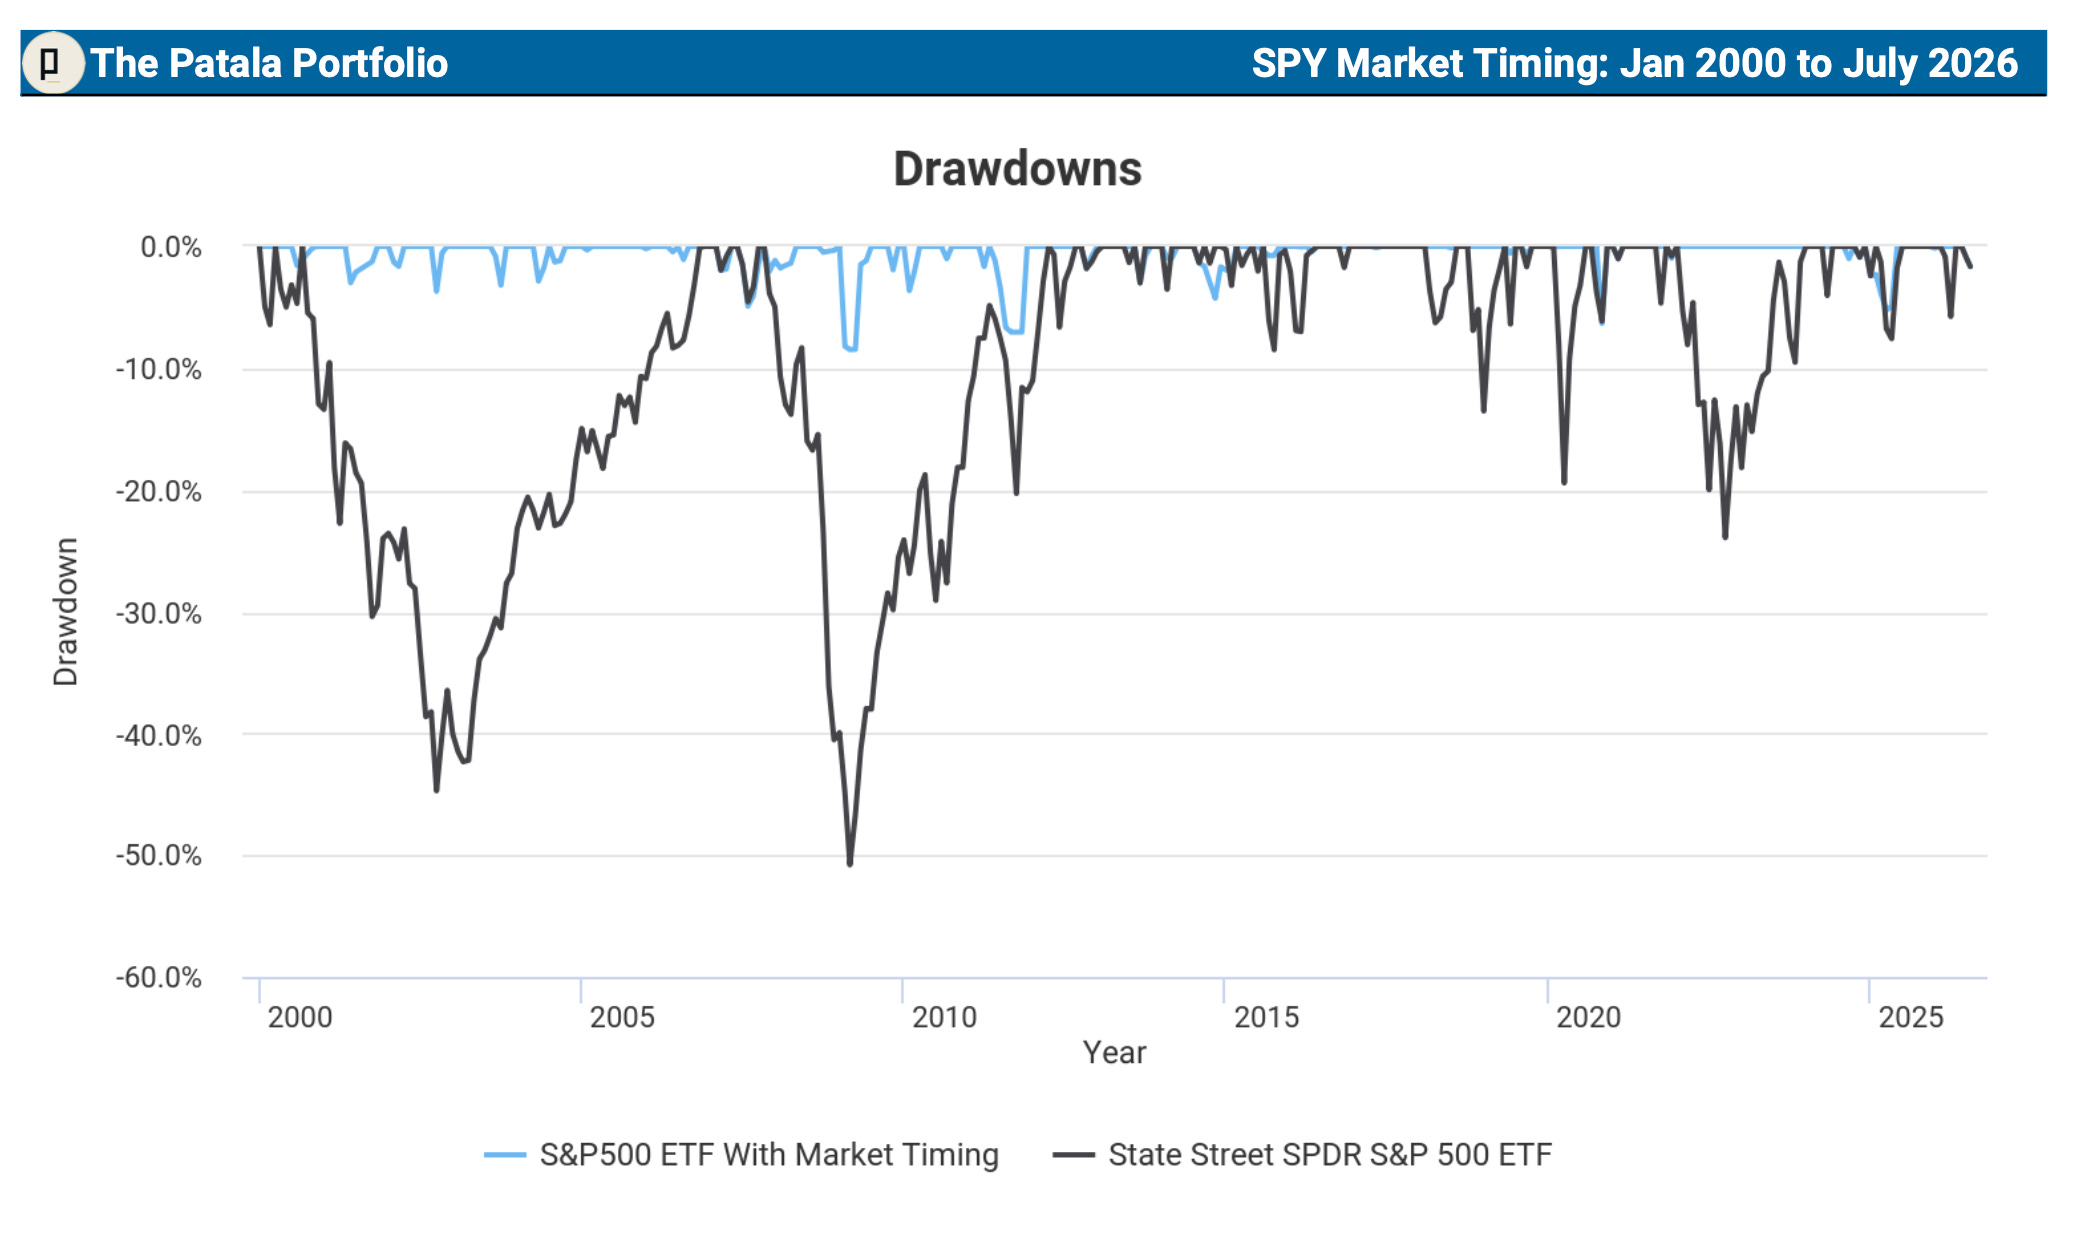
Look at that chart. Across 26+ years — when the dot-com crash took the S&P 500 down 44%, and the 2008 crisis took it down 50% — the timing system was sitting in cash. Its worst drawdown over the entire period was just 8.5%.
The stress-period numbers from the report tell the whole story:
Dot-com crash (2000–2002): system −3.7% vs buy & hold −44.7%
Subprime crisis (2007–2009): system −8.5% vs buy & hold −50.8%
COVID-19 crash (2020): system −0.04% vs buy & hold −19.4%
The system didn’t win by reaching higher. It won by falling less — and by never having a deep hole to climb out of.
Every risk measure, side by side — 26+ years
I’m an engineer, so let me give you the full dashboard rather than a cherry-picked stat. These come directly from the Portfolio Visualizer report, covering January 2000 through July 2026:
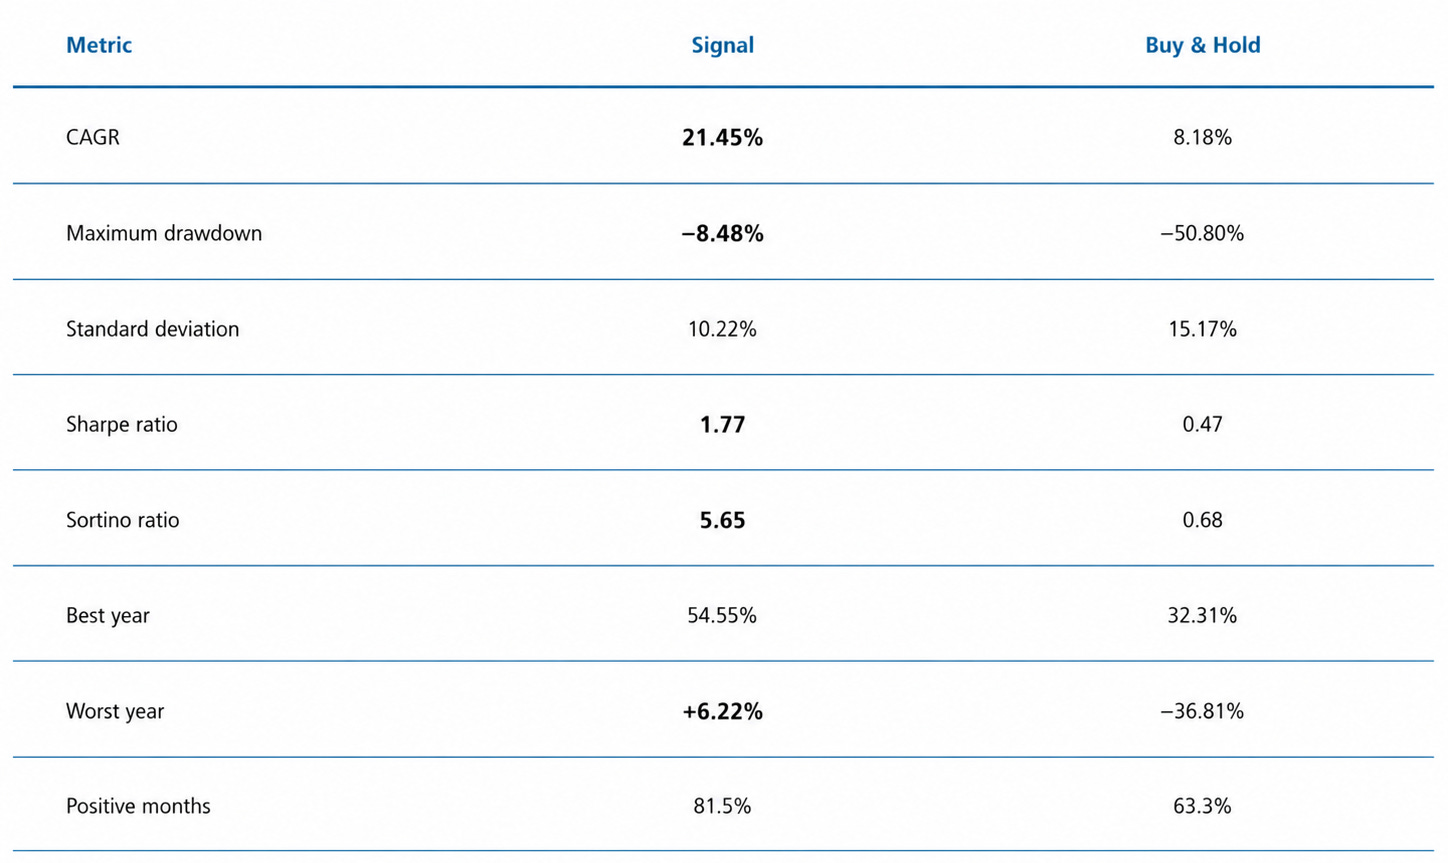
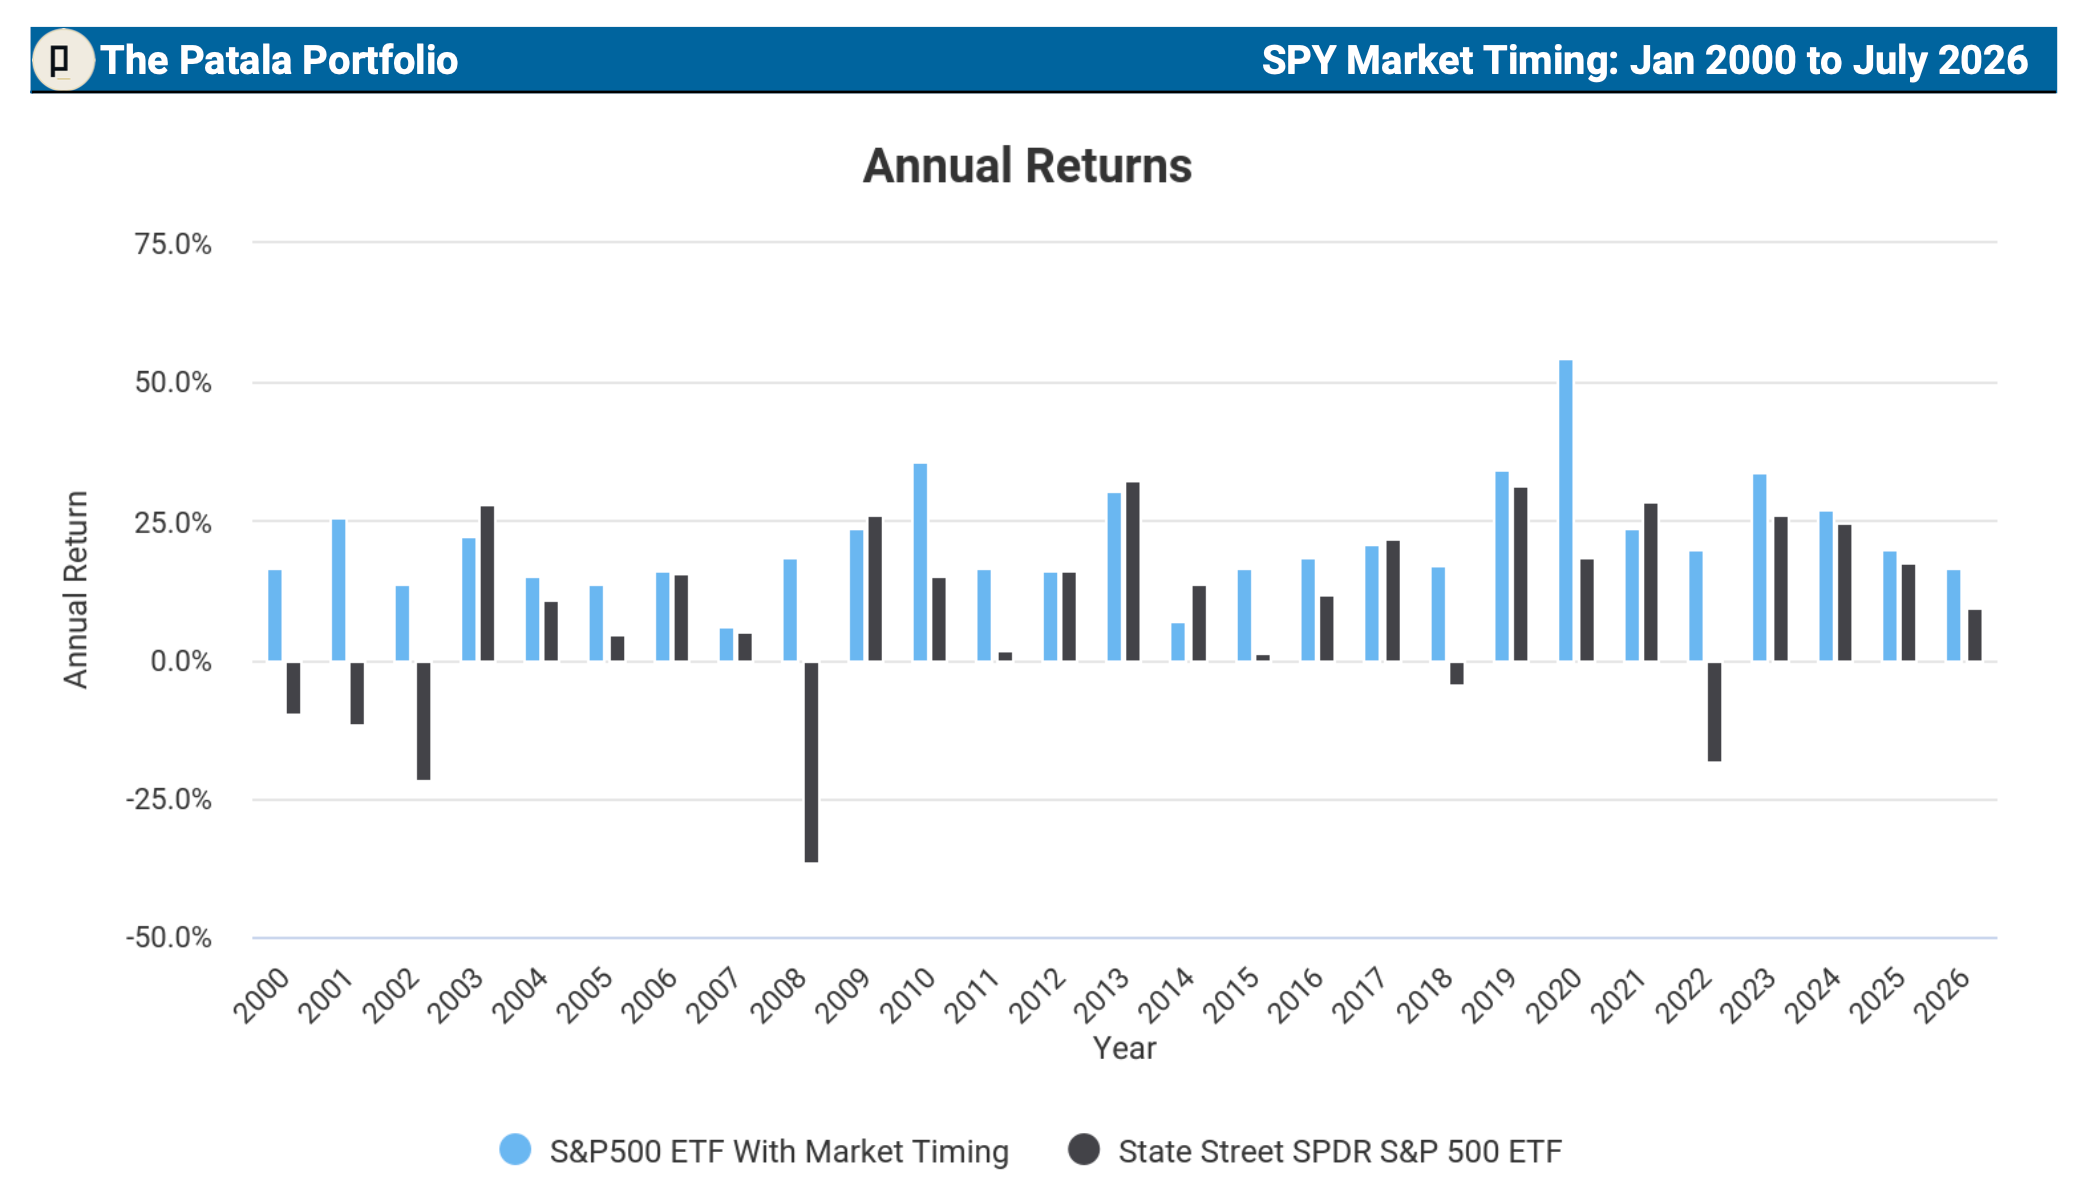
Read the worst-year line twice. Across 26+ years, the system’s worst calendar year was positive — up 6.22%. It never lost money in a full year, through the dot-com crash, 2008, COVID, and 2022. Buy and hold had a −36.81% year.
And notice the risk-adjusted ratios. A Sharpe of 1.77 versus 0.47. A Sortino of 5.65 versus 0.68. Over more than two decades the system produced far more return for every unit of risk — with lower volatility (10.22% vs 15.17%) and higher returns at the same time. That combination is supposed to be difficult. Here it comes from a single discipline, applied consistently for 26+ years.
How it works — two layers
I built it the way an engineer builds a control system: one layer to set direction, a second, faster layer to react to the present.
Layer 1 — The macro model. On the first trading day of each month, it produces a single call: BUY or SELL. This is the strategic backbone, reading the broad market environment.
Layer 2 — The daily zones. Every day, the model divides the S&P 500 into 158 distinct zones. Only 11 of those zones trigger a SELL. Everything else means stay invested. Layer 2 catches danger that arrives mid-month.
That second number is the heart of the design. Out of 158 zones, only 11 say “get out.” The model is built to stay invested — it ignores routine dips and sideways chop, and only steps aside when price enters genuine danger. The bar to leave the market is deliberately high, and 26+ years of backtesting is what calibrated exactly where those danger zones sit.
How you actually use it
At the end of each trading day, the system produces the signal for the next trading day. Two states, two actions:
BUY → be 100% invested in your chosen asset.
SELL → be 100% in cash.
That´s the entire operating manual. You check the signal after the close; if it changed, you place one trade the next day. Most days, nothing changes at all.
Three ways to run it
One asset, one signal. Follow the signal on a single asset — SPY, QQQ, or (for the aggressive) TQQQ. This SPY report is that version.
Inside your IRA / 401(k). The same signal works on any S&P 500 or total-market index fund. No special account, no derivatives — just move between the fund and cash in the retirement account you already have.
The blended portfolio. 50% in an index fund, 50% split equally across the 10 highest-potential stocks I publish each month — all governed by the same signal. This is the full Patala Portfolio.
Why I’m making this public
For many years this was mine — a private system I built, tested, and perfected across 26+ years of market history. For the past five years I’ve trusted it with the money I manage - over $1 Million. Now I want to build the live track record in the open — every signal, posted as it happens, wins and losses both. The 26+ year backtest is the evidence. The live record is the proof that matters now.
In the next articles, I’ll show the same system on QQQ — the Nasdaq 100 — where buy & hold fell 83% in the dot-com crash, and where a $10,000 stake grew into millions.
If you want a patient, systematic, hype-free approach to the market, follow along. The live record starts now.
The simplest market timing signal in the world. One signal. One trade when it flips. Built on 26+ years of research. Under five hours a year to run.
*Disclaimer: I am not a registered investment adviser, and nothing here is personalized investment advice, a recommendation, or an offer of advisory services. This publication is for informational and educational purposes only. Performance figures are generated by Portfolio Visualizer from historical data and a backtested application of the signal; backtested results are hypothetical, have inherent limitations, and do not guarantee future results. Consult a qualified financial adviser before investing. You are solely responsible for your own decisions.*