

I launched this newsletter at the end of July, and published my first live signal on July 26. I’m tracking the live performance completely from scratch August onwards — no cherry-picked history, no prior track record carried over. This is that first monthly report, and I’ll publish one like it every month going forward.
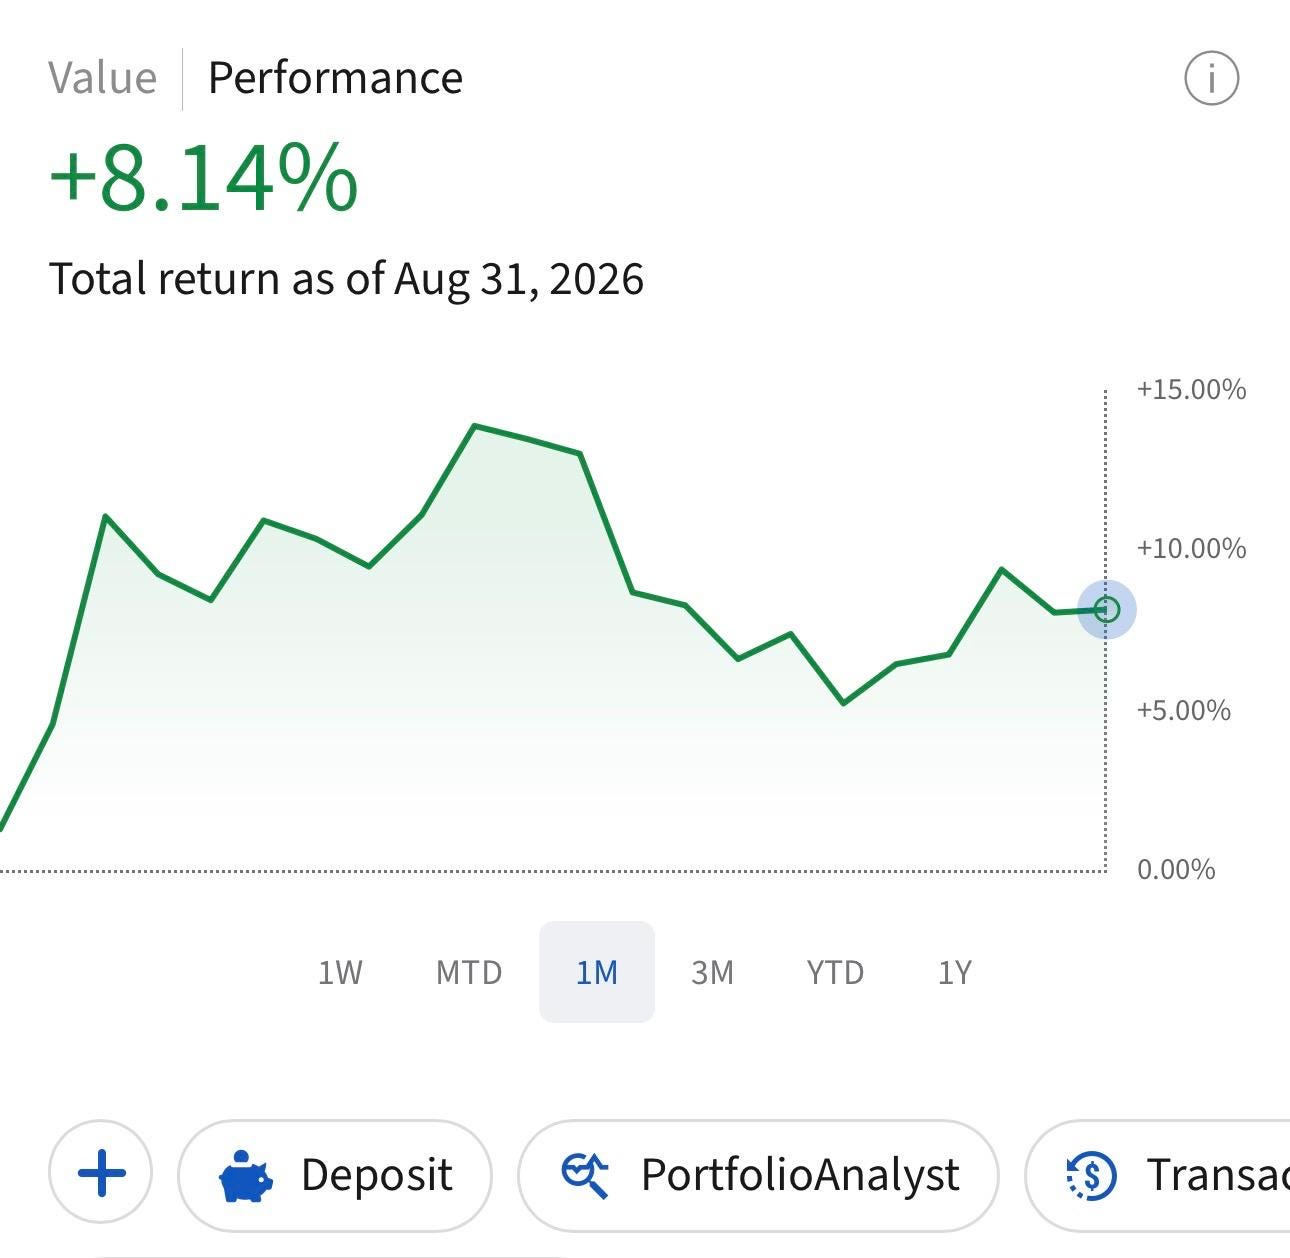
For the month of August, the account is up +8.14%, against +2.68% for SPY over the same stretch (Interactive Brokers 1-month performance screenshot as of Aug 31st)
A couple of things worth knowing before that number gets too much credit:
No money was added or withdrawn. This is trading performance, plain and simple.
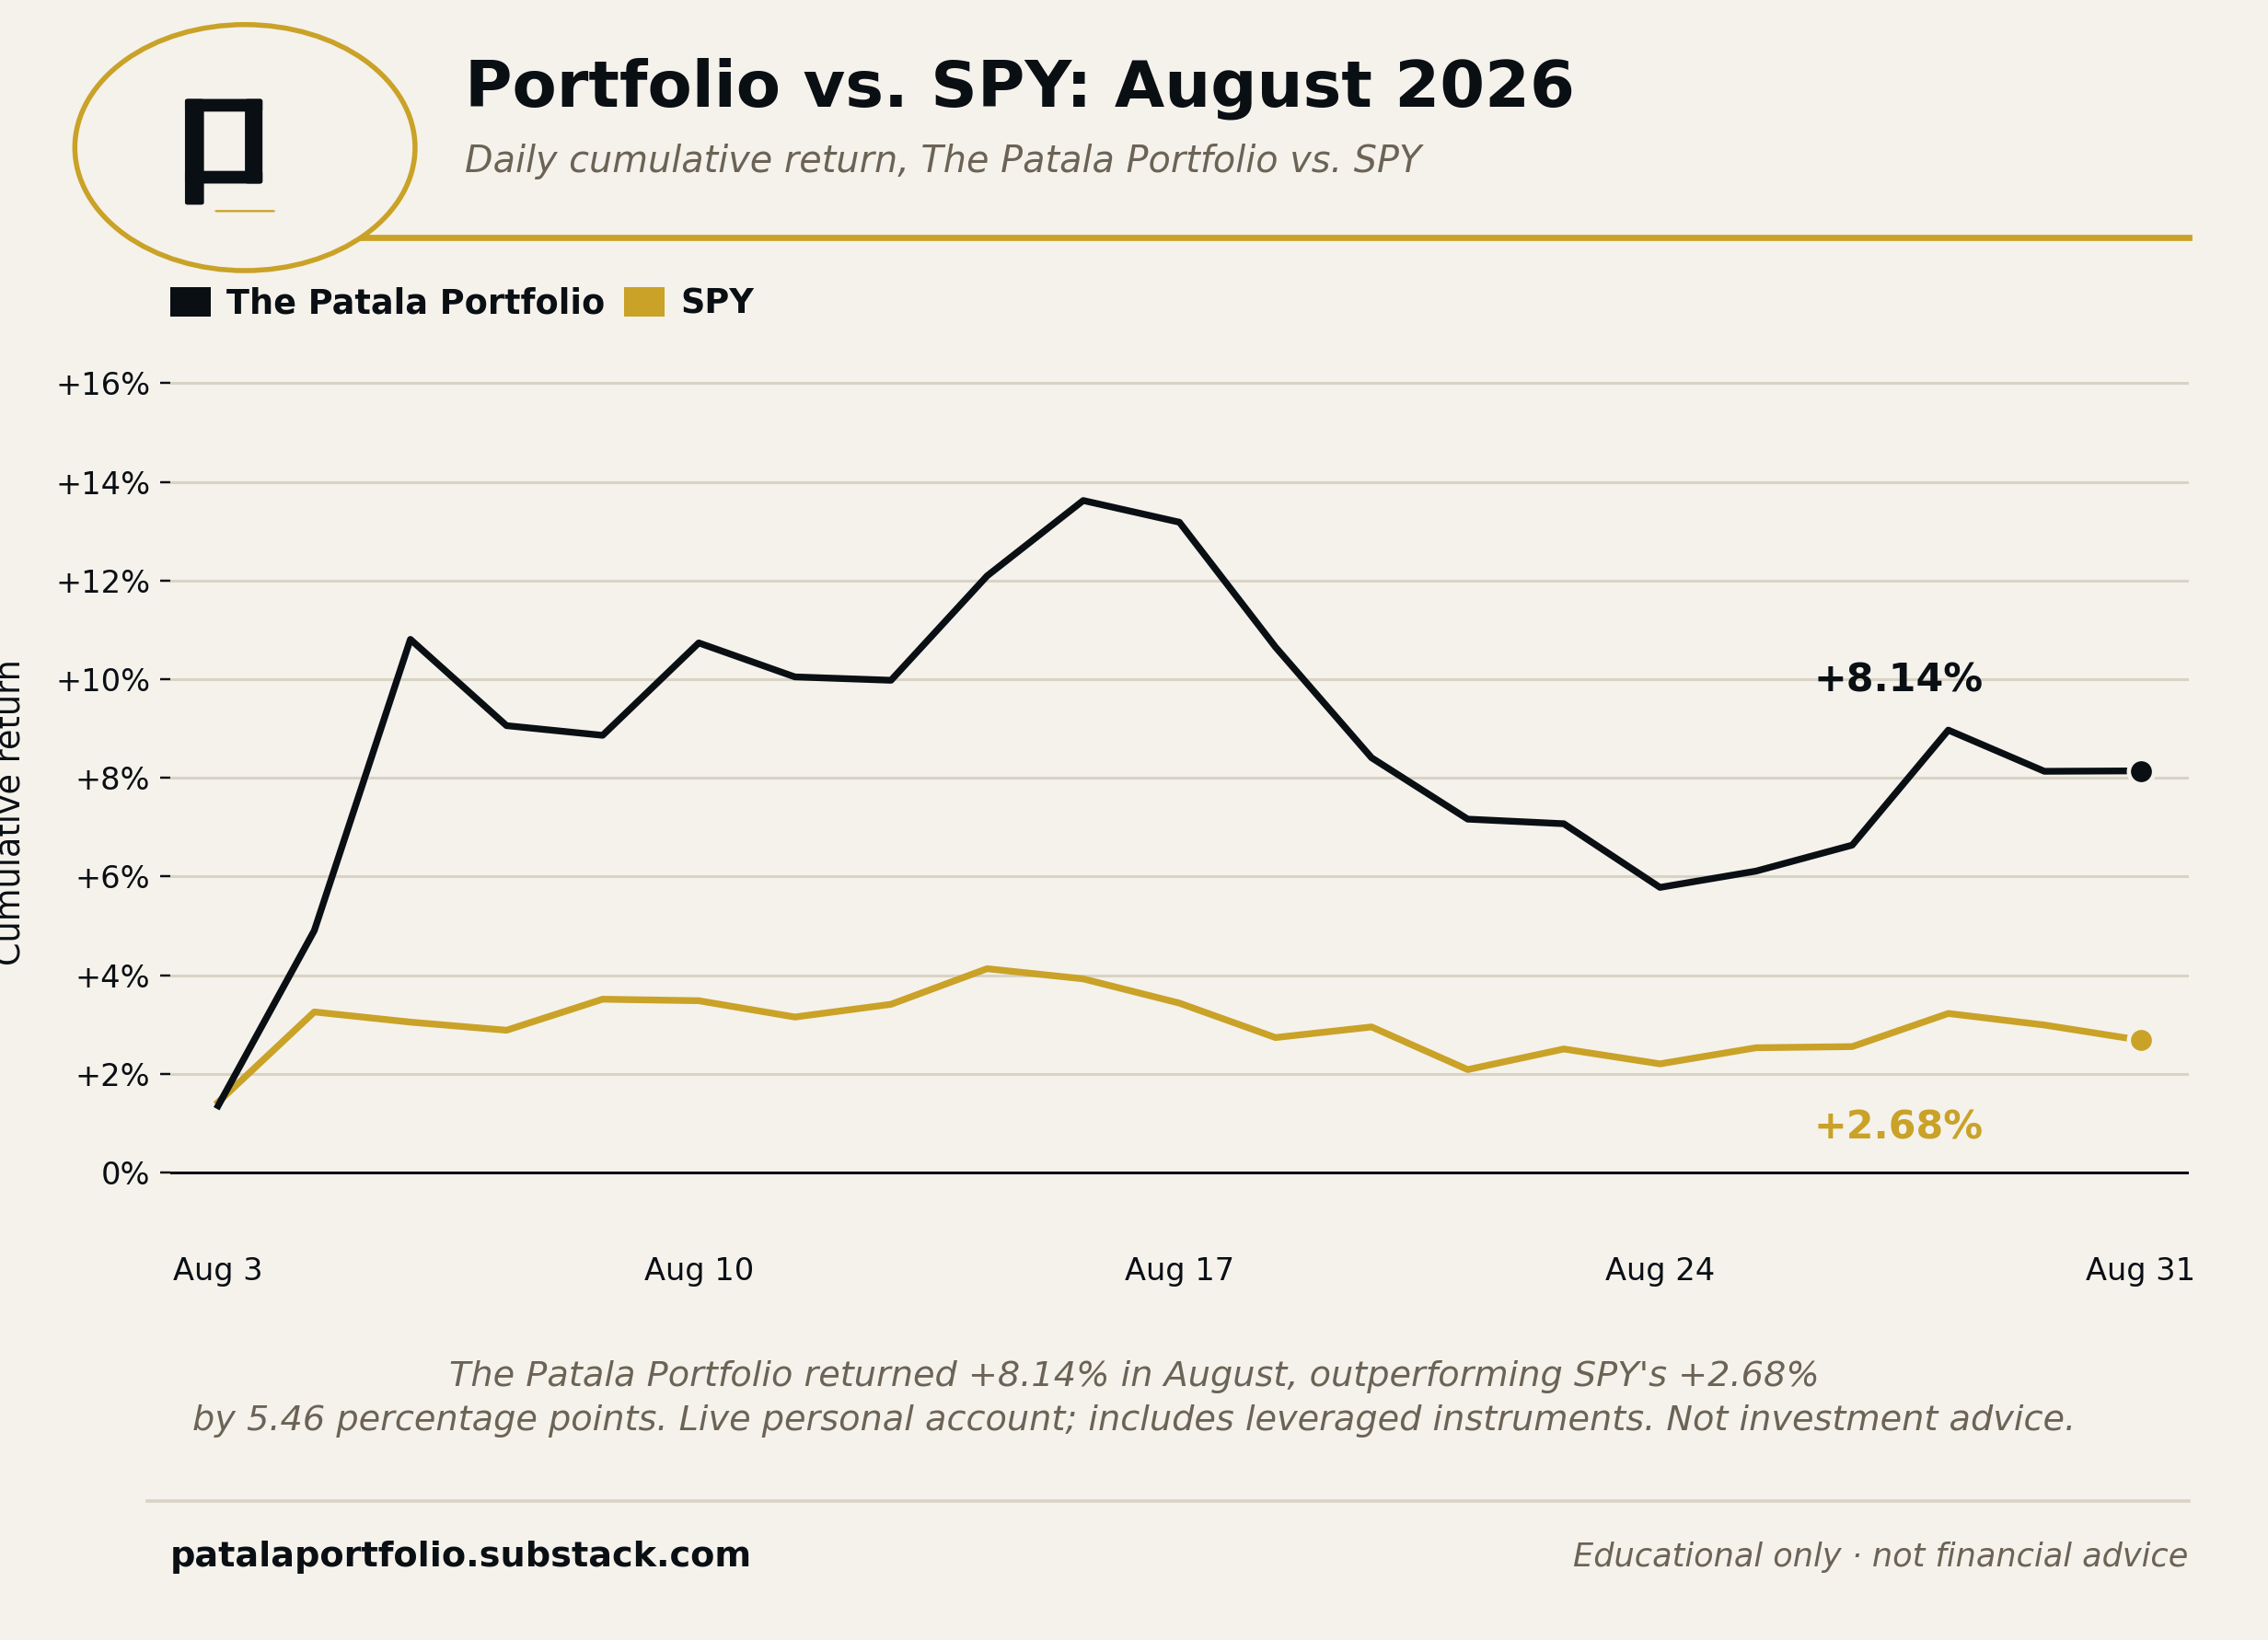
It wasn’t a smooth ride. The account was down more than -5% in the first week before recovering, then bounced between roughly +5% and +14% for the rest of the month before settling at +8.14% on the close. Systematic doesn’t mean comfortable — it means staying in your seat through the parts that don’t feel good.
How these updates work: every monthly portfolio update comes in two parts.
Part 1 explains how the strategy works — it’s the same every month.
Part 2 is the actual deep dive: every position in the account, what changed, and how it performed.
Part 1: The Strategy
Every monthly update starts here. The strategy doesn’t change month to month — only the numbers do. If you’ve read this part before, feel free to skip ahead to Part 2.
One signal. That’s it.
Everything in this portfolio comes down to one quant timing signal, built over twenty-plus years. It has two parts:
A macro model that makes one BUY or SELL call on the first trading day of each month.
A daily model that splits the market into 158 zones. Only 11 of them trigger a SELL — so the signal stays invested through normal ups and downs, and only steps aside when things get genuinely dangerous.
Put together, the signal flips about 9–12 times a year. That’s the whole job: check it, act if it flips, sit tight the rest of the time.
Here’s what that’s done in backtesting, verified independently through Portfolio Visualizer:
SPY, since January 2000: a hypothetical $10,000 grows to $1.75 million, with a worst drawdown of just -8.5% — versus -50.8% for simply buying and holding.
QQQ, same 26+ years: $10,000 grows to $9.2 million (a 29.28% annual return) versus $90,406 for buy-and-hold (8.64%). The signal also sidestepped the dot-com crash’s brutal 81% collapse, with a worst drawdown of only -9.97%.
The signal doesn’t win by picking better stocks — it owns the exact same index either way. It wins by simply not being there for the crashes.
The Core: your engine
You get to choose what the signal drives:
SPY — 500 companies, broadly diversified, steadier. The conservative choice.
QQQ — 100 growth-heavy names, more volatile, historically higher-returning. The aggressive choice.
Whichever you pick becomes your Core — what you hold whenever the signal says BUY.
For those who want to go further, the same signal applied to TQQQ (a 3x-leveraged Nasdaq-100 fund) turned a hypothetical $10,000 into $1.56 billion over a 16-year backtest (2010–2026), versus $3.2 million for buy-and-hold. A few honest caveats come with that number:
It’s a hypothetical backtest, not real trading.
The window starts near the bottom of a historic bull run.
Leverage decays in choppy, sideways markets.
This isn’t a recommendation to hold 3x leverage unhedged.
Still, the same mechanism is doing the work: the signal’s worst drawdown on TQQQ was -26.03%, versus a 79.08% buy-and-hold collapse in 2022.
The Plus: one high-conviction stock a week
On top of the Core sits QuantRanks, the stock-picking half of the model. Here’s how it works:
Every Sunday at 6:00 pm ET, the model surfaces its top-ranked pick from a universe of 450+ stocks.
It’s funded by trimming a small slice of the Core, then bought the following Monday.
It’s held until the signal flips to SELL — at which point Core and picks all go to cash together.
There’s no separate exit rule and no price target for individual picks. The signal governs the whole portfolio.
Two guardrails keep the stock sleeve from taking over:
Each buy is typically sized around 3% of the portfolio. That’s not a hard cap on the stock itself, though — if the same name stays in the top-ranked picks for multiple weeks running, I’ll keep adding to it each time it reappears.
The sleeve as a whole is capped at 50%, so at least half the book always stays in the Core.
Why “Core-Plus”
Three layers, three jobs:
The Signal decides when — invested or in cash.
The Core decides what you hold — SPY, QQQ, or a leveraged version.
The Picks decide what you add — one high-conviction stock a week.
The Patala Live Portfolio runs this exact system with my own money, and I report the full result every month — allocations and percentages, not dollar amounts. That way, what transfers to you is the strategy, not my account size.
Full backtests and methodology:
The Simplest Investment System in the World · $10,000 in the Nasdaq Since 2000 · Same Signal + 3x the Leverage · The Patala Core-Plus Strategy
The headline number
For the month of August, the account is up +8.14%, against +2.68% for SPY over the same stretch.
Here’s the full breakdown of how my portfolio stood on August 31 — every asset, and its exact weight in the book. Except for the 4 QuantRanks stocks I published and bought starting August 10, everything else here was a pre-existing position that makes up the Core of an aggressive portfolio.
Part 2: Inside the August Portfolio
What’s actually in the account?
Subscribe free to unlock the full portfolio
A free subscription gets you:
Weekly trade signals on SPY, BTC, and GLD + real-time flip alerts.
The stock I buy every Monday.
Monthly live portfolio performance & all holdings.